 E-Submission
Indexed in: ESCI, Scopus, PubMed,
PubMed Central, CAS, DOAJ, KCI
PubMed Central, CAS, DOAJ, KCI
FREE article processing charge

Articles
- Page Path
- HOME > J Yeungnam Med Sci > Volume 37(1); 2020 > Article
-
Original article
Correlation between anterior thigh pain and morphometric mismatch of femoral stem -
Haksun Chung
 , So Hak Chung
 -
Yeungnam University Journal of Medicine 2020;37(1):40-46.
DOI: https://doi.org/10.12701/yujm.2019.00325
Published online: September 16, 2019
Department of Orthopaedic Surgery, Kosin University College of Medicine, Busan, Korea
- Corresponding author: So Hak Chung, Department of Orthopaedic Surgery, Kosin University Gospel Hospital, 262 Gamcheon-ro, Seo-gu, Busan 49267, Korea Tel: +82-51-990-6467, Fax: +82-51-243-0181, E-mail: shchung@kosin.ac.kr
• Received: April 22, 2019 • Revised: August 15, 2019 • Accepted: September 5, 2019
Copyright © 2020 Yeungnam University College of Medicine
This is an Open Access article distributed under the terms of the Creative Commons Attribution Non-Commercial License (http://creativecommons.org/licenses/by-nc/4.0/) which permits unrestricted non-commercial use, distribution, and reproduction in any medium, provided the original work is properly cited.
- 21,670 Views
- 121 Download
- 1 Crossref
Abstract
-
Background
- Postoperative pain occurring after hip arthroplasty has become common since the expanded use of cementless femoral stems. The characteristic pain develop in the anterolateral thigh area. This study aimed to predict anterior thigh pain based on the measurements of postoperative anteroposterior (AP) and lateral (Lat) radiographs of the hip joint.
-
Methods
- The present study included 26 patients (29 hips) who underwent total hip replacement or bipolar hemiarthroplasty between March 2010 and May 2016, whose complete clinical information was available. AP and Lat radiographs of the affected hip were taken on the day of surgery and 1 and 6 months postoperatively. Patients with improper radiographs were excluded. The distance from the femoral stem to the nearest cortical bone in the distal region of the stem was measured. The patient group with a visual analog scale (VAS) score of ≥6 points was designated as patients with anterior thigh pain.
-
Results
- Sex, age, weight, height, body mass index, and bone mineral density in the lumbar spine and femur did not have a significant effect on postoperative VAS scores (p>0.05). Presence of contact between the femoral stem and cortical bone was associated with postoperative anterior thigh pain.
-
Conclusion
- Hip AP and Lat radiographs are usually taken to confirm fixation and alignment of the femoral stem after hip arthroplasty. The measurement method introduced in this study can be utilized for predicting anterior thigh pain after hip arthroplasty.
- Thigh pain after hip arthroplasty typically appears in the anterior thigh. Such pain reportedly occurs in approximately 3%-25% of cases and is more common in cases that used a cementless rather than a cemented stem [1-8]. Especially in cementless technique, initial stability is vital for biologic fixation. However, when initial stability is not achieved, a loose prosthesis might initiate pain. Anterior thigh pain after hip arthroplasty is also associated with femoral stem size, use of cement, femoral stem design and material, femoral stem instability, and loosening and disharmony in flexural strength between the bone and femoral stem [4,8-15]. It is believed that cancellous bone and type-C nerve fibers that accompany blood vessels within the bone unit may be associated with postoperative anterior thigh pain by responding to changes in pressure and local extension [16]. The purpose of the present study was to predict anterior thigh pain based on measurements of the postoperative anteroposterior (AP) and lateral (Lat) radiographs of the hip joint.
Introduction
- 1. Ethics statement
- We conducted this study in compliance with the principle of the Declaration of Helsinki. The design and protocol of this retrospective study were approved by the Institutional Review Board of Kosin Gospel Hospital (IRB No. 2017-12-011). Since this was a retrospective study, the requirement for informed consent was waived.
- 2. Subjects
- The present study retrospectively included 26 patients (29 hips) who underwent hip arthroplasty between March 2010 and May 2016, with their complete clinical information available. There were 14 patients (16 hips) who underwent total hip arthroplasty and 12 patients (13 hips) who underwent bipolar hip arthroplasty. Preoperative diagnoses included avascular necrosis of the femoral head (n=14), femoral neck fracture (n=10), intertrochanteric fracture (n=2), solitary myeloma (n=1), synovial sarcoma (n=1) and secondary coxarthrosis (n=1); avascular necrosis of the femoral head was the most common diagnosis (Table 1).
- The femoral stem used in surgery consisted of the Bencox® (Corentec, Seoul, Korea) ID stem proximal fit and filled cementless femoral stem. We included patients who were operated on with only Bencox® ID stem and excluded other stems.
- Patients with improper radiographs were excluded. Patients with distal anterior or Lat thigh pain, extending beyond the groin area, were considered to have anterior thigh pain, while patients with posterior thigh pain or gluteal pain were excluded from the experimental group.
- 3. Surgical methods and postoperative care
- The same surgeon performed all surgeries using a modified Hardinge approach. The femoral stem was inserted using the press-fit technique based on preoperative templating and an intraoperative decision by the surgeon. In total hip replacement arthroplasty cases, the press-fit technique was also used for the acetabular implant, while additional screw fixation was used on all patients.
- The prophylactic intravenous antibiotic was administered preoperatively to all 26 patients, while low-molecular-weight heparin was used as per standard postoperative protocol to prevent thrombosis. Quadriceps contraction training was implemented from the first day and partial weight-bearing walking exercise using a walker was implemented within postoperative 1 week. Total weight-bearing was allowed for all patients within 2 weeks postoperatively.
- 4. Clinical evaluation
- For the investigation of anterior thigh pain, pre and postoperative visual analog scales (VAS; preoperative and postoperative 1 and 6 months) were used. Investigated factors include the final follow-up period, sex, age, type of implant, disease, and distance between the femoral stem and cortical bone.
- Postoperative physical examination referenced the definition suggested by Barrack et al. [1] for the diagnosis of anterior thigh pain. Patients with distal anterior or lateral thigh pain, more than in the groin area, were considered to have anterior thigh pain, while patients with posterior thigh pain or gluteal pain were excluded from the experimental group. Also, patients with radiating pain extending to the calf or foot were excluded from the experimental group.
- The patient group with VAS score of ≥6 points postoperatively was designated as the 'patients with pain' group, while the group with VAS score of ≤5 points postoperatively was designated as the 'patients without pain' group. The 'patients with pain' group included 13 hips (10 patients), with VAS scores of 6 points for 6 hips, 7 points for 2 hips, and 8 points for 5 hips. The 'patients without pain' group included 16 hips (16 patients), with all hips having a VAS score of 1 point.
- 5. Radiological evaluation
- We have taken an AP hip radiograph (standard total hip) to include images of both sides of the hip on the same film that project towards the middle of the line connecting the upper symphysis pubis and anterior-superior iliac spine. Both patellae were faced forward and lower extremities were internally rotated by 15°–20° to accommodate femoral anteversion. To obtain the affected hip Lat radiographs (hip joint axial), the patient was turned onto the affected hip at least 45° with a hip flexion angle of 90° and internal rotation angle of 45° in a supine position. Images were then taken vertically from the groin region.
- For evaluation of fixation and alignment between the femoral stem and acetabular implant, hip AP and affected hip Lat radiographs were acquired from all patients on the day of surgery and at 1 and 6 months postoperatively. For confirmation of contact, the shortest distance from the femoral stem to the nearest cortical bone was measured. Since there was no admissible definition of measurement for the contact between femoral stem and cortex, we measured the gap in the distal region of the stem to the cortical bone in AP and axial view (Fig. 1). Three orthopedic specialists independently interpreted the radiographs. This study statistically analyzed the average value of the three specialists’ measurements.
- 6. Statistical analysis
- We conducted statistical analysis with Student t-test, logistic regression and linear mixed-effects regression.
- Kolmogorov-Smirnov test was done to confirm the normality of the data. With log-transformation, normality of data was established. Student t-test was used for a grid search to find out the cut-off value of stem to femoral distance (Table 2). Logistic regression was used for risk factor analysis. A p-value of less than 0.05 was considered to be statistically significant (Table 3). To investigate the association between anterior thigh pain and stem to cortex distance, linear-mixed effects regression was used for repeated measured data (Table 4). IBM SPSS version 20.0 (IBM Corp. Armonk, NY, USA) was used for all statistical calculations.
Materials and methods
- All patients were reviewed for at least 2 years. The median period of follow-up was 4 years. The patient population included 12 males (14 hips) and 14 females (15 hips). At the time of surgery, the median age was 63 years (range, 25–86 years); median weight 67.0 kg (range, 42.0–81.0 kg); median height 161.7 cm (range, 143.0–179.0 cm); and median body mass index (BMI) 23.9 (range, 15.8–31.6). In addition, median bone mineral density (BMD) T-score was -1.4 (range, -3.5–3.8) in the lumbar spine (L-spine) and -1.7 (range, -3.5–0.8) in the femur (Table 1).
- Thirteen hips with anterior thigh pain had a median value of the stem to cortex distance of 0.65mm (range, 0.32–1.01 mm) in the AP view and 0.72 mm (range, 0.41–1.77 mm) in the Lat view postoperatively (Table 5). Sixteen hips without pain had a median value of 1.65 mm (range, 0.51–2.94 mm)in the AP view and 1.82 mm (range, 0.96–4.72 mm) in the Lat view, postoperatively (Table 5). Radiolucent line around the stem were not visible in the radiographs of all patients. The cut-off value for the stem to cortex distance was chosen as 0.8 mm, which is statistically significant in Student t-test (Table 2). There was no statistically significant association between anterior thigh pain and patient's sex, age, weight, height, BMI, and L-spine and femoral BMD T-score (p>0.05; Table 3). Since the association of stem to cortex distance on logVAS is strongly negative, it was shown that thigh pain after hip arthroplasty diminished over time (Table 3, p<0.05). Presence of contact between the femoral stem and cortical bone (stem to cortex distance<0.8 mm) was associated with postoperative anterior thigh pain (Tables 3, 4).
Results
- Thigh pain after hip arthroplasty typically appears in the anterior thigh. Barrack et al. [1] reported that such pain reportedly occurs in up to 40% of cases. The percentage of symptomatic patients in this study is higher than that in other reports and a small number of cases is the potential reason for this.
- Since the 1970s, various fixation methods using cementless implants have been introduced. These implants have shown better biocompatibility than those used in cement-based fixation methods and have been preferred over implants that use cement because of their advantage of secondary fixation to prevent contact between the implant and bone [18]. However, postoperative anterior thigh pain was repeatedly reported to be more common with cementless than with cemented stems [2,4-7,17].
- The exact significance and cause of thigh pain after hip arthroplasty have not been identified. Since operational goals include the elimination of pain, stable fixation of the femoral stem, recovery of biomechanical function and restoration of the femoral shape [19], anterior thigh pain can be viewed as an essential factor that can diminish postoperative patient satisfaction.
- Hedley et al. [20] described thigh pain that appears after cementless hip arthroplasty as a benign complication that appears in the early stage after surgery and dissipates naturally, whereas Campbell et al. [4] reported it to be an unusual and dangerous sign of an unstable femoral stem, indicating failure in biomechanical fixation. While some papers have reported anterior thigh pain in association with the instability of the implant and fixation failure [4,15], others have reported that severe anterior thigh pain may be found among patients who underwent hip arthroplasty using a cementless femoral stem despite firm fixation, proper alignment and proper implant size [8,13].
- The exact etiology of anterior thigh pain that appears in patients with stable implant fixation remains unclear. The most widely recognized hypothesis attributes the cause to an abnormally high level of bone stress at the femoral stem tip; such abnormal bone stress was reported to have been caused by disharmony in flexural strength between the cortical bone and femoral stem [2,10,12,14].
- Namba et al. [12] studied femoral stress at the femoral stem tip in association with various factors and stated that the directionality of the femoral stem might explain why postoperative thigh pain appears mostly in the anterior area. Vresilovic et al. [14] investigated the effects of femoral stem size on the prevalence of postoperative anterior thigh pain and reported that an increase in stem size usually resulted in increased pain. As the stem size increases, the cross-sectional size increases, which causes an increase in flexural strength [21]. This can cause a sudden shift in the femoral stem tip during hip joint movement.
- Directionality and cross-sectional area of the femoral stem mentioned in preceding studies can be viewed with contact with cortical bone at the femoral stem tip, which may be associated with nociceptors in the endosteum of cortical bone and the presence of unmyelinated type-C nerve fibers within the Haversian canal [16,22].
- Limitations in the present study included the following: first, if radiographs were taken with a slight rotation, it might cause an error in measurement. We tried to prevent this problem by taking an accurate AP and axial view. Second, since only AP and Lat radiographs were acquired, the distance between the femoral stem and cortical bone was not measured from various angles. Third, the number of cases is small compared to that of other studies. Fourth, the age and diagnosis of patients are heterogeneous.
- Since computed tomography examination presents limitations from a cost-effectiveness aspect, a plain radiograph is preferred for routine examination for checking fixation and alignment of femoral stem after hip arthroplasty. The plain radiograph is low-cost and could be routinely performed after hip arthroplasty. We believe that the method used in the present study was meaningful since it can be used to predict anterior thigh pain with plain radiography. According to our study, if stem to cortical distance is smaller than 0.8 mm in the distal region of the stem, the possibility of anterior thigh pain after hip arthroplasty can be expected.
Discussion
Fig. 1.A 53-year-old male underwent artificial bipolar hip arthroplasty for femoral neck fracture (Garden Type IV). The patient complained of moderate anterior thigh pain starting from postoperative day 1. (A) Anteroposterior view. (B) Lateral view.
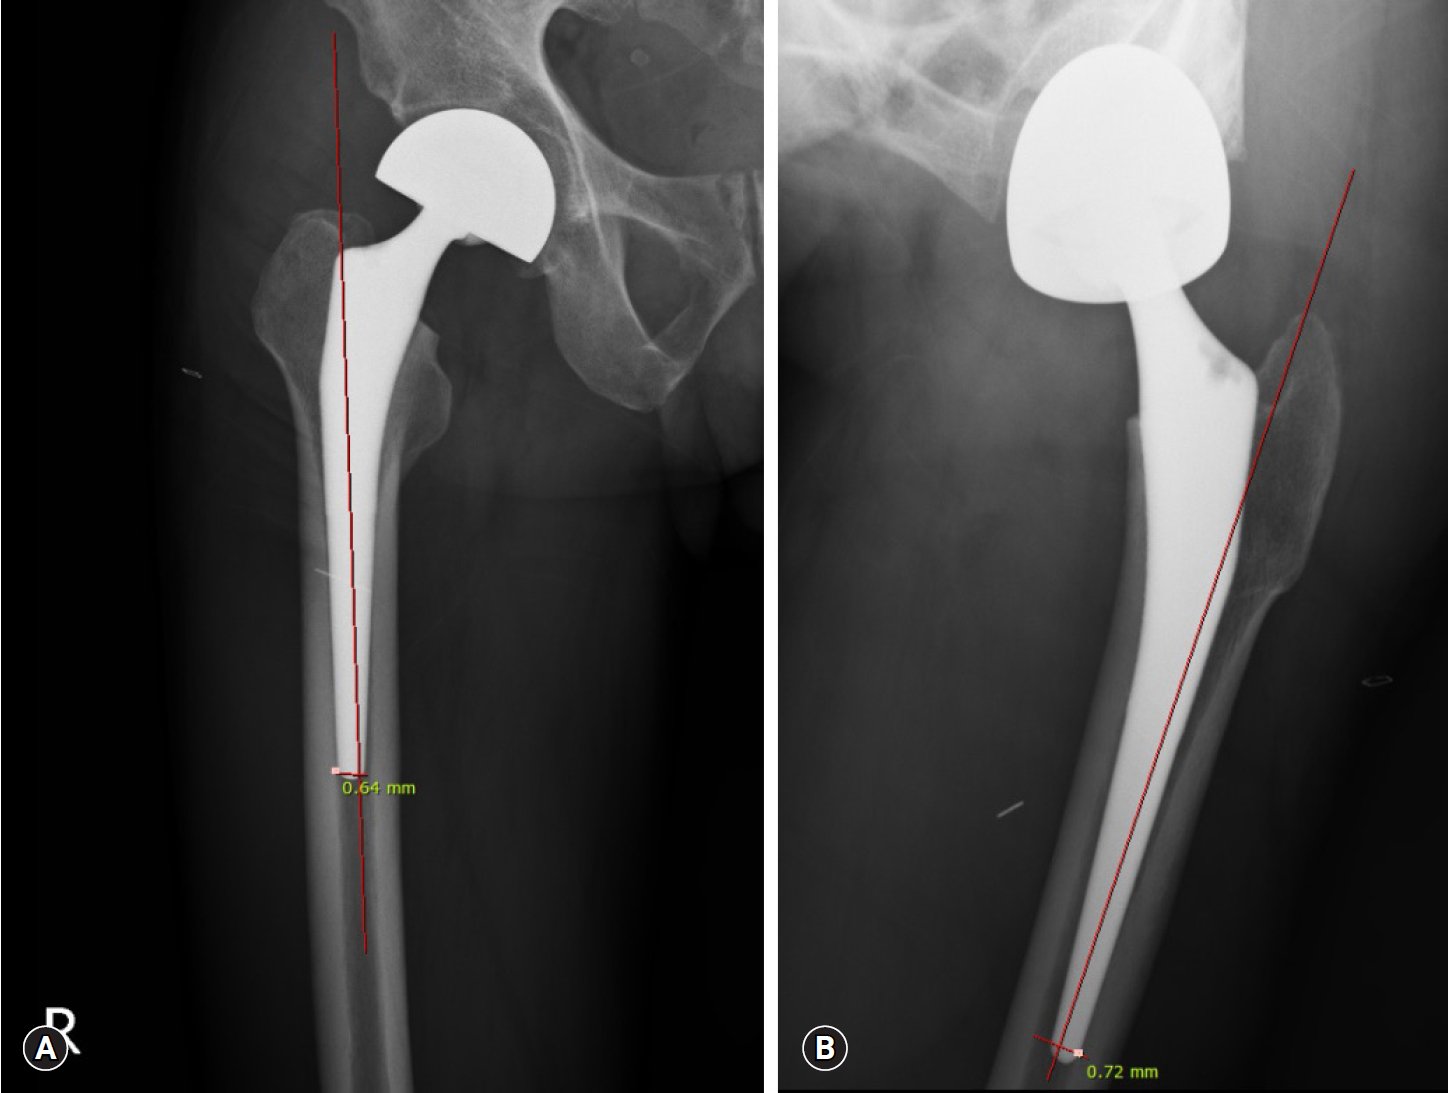
Table 1.Dermographic data
Table 2.Cut-off value of stem to femoral distance (Student t-test)
Table 3.Logistic regression for risk factor analysis
Table 4.Linear-mixed model to analyze association between anterior thigh pain and stem to cortex distance
| Independent variable | Beta | Standard error | t-value | p-value | CI | |
|---|---|---|---|---|---|---|
| Minimum | Maximum | |||||
| Constant | 0.6107 | 0.4598 | 1.3280 | 0.0938 | -0.3029 | 1.5243 |
| Stem to cortex distance | -0.5992 | 0.1289 | -4.6490 | <0.001 | -0.8570 | -0.3414 |
Table 5.Distance in 0, 1, and 6 months
| Patient no. | Aa) (mo) | Bb) (mo) | ||||||||||
|---|---|---|---|---|---|---|---|---|---|---|---|---|
| 0 (AP) | 0 (Lat) | 1 (AP) | 1 (Lat) | 6 (AP) | 6 (Lat) | 0 (AP) | 0 (Lat) | 1 (AP) | 1 (Lat) | 6 (AP) | 6 (Lat) | |
| 1 | 0.64 | 1.77 | 0.72 | 1.72 | 0.72 | 1.65 | 1.92 | 2.50 | 1.87 | 2.38 | 1.85 | 2.20 |
| 2 | 1.01 | 0.68 | 0.92 | 0.66 | 0.93 | 0.64 | 1.28 | 3.17 | 1.20 | 2.98 | 1.31 | 2.88 |
| 3 | 0.80 | 0.51 | 0.87 | 0.36 | 0.82 | 0.49 | 1.87 | 1.43 | 1.68 | 1.25 | 1.77 | 1.30 |
| 4 | 0.66 | 0.72 | 0.56 | 0.68 | 0.52 | 0.52 | 1.98 | 1.13 | 1.85 | 1.20 | 1.90 | 1.21 |
| 5 | 0.96 | 0.72 | 1.01 | 0.45 | 0.89 | 0.62 | 1.28 | 1.13 | 1.17 | 1.10 | 1.10 | 1.10 |
| 6 | 0.32 | 0.51 | 0.32 | 0.45 | 0.28 | 0.50 | 1.44 | 1.58 | 1.42 | 1.50 | 1.50 | 1.62 |
| 7 | 0.51 | 0.72 | 0.42 | 0.63 | 0.49 | 0.65 | 0.51 | 0.96 | 0.40 | 0.88 | 0.45 | 0.77 |
| 8 | 0.64 | 0.41 | 0.58 | 0.36 | 0.52 | 0.28 | 0.97 | 2.58 | 1.13 | 2.42 | 0.89 | 2.30 |
| 9 | 0.80 | 0.78 | 0.82 | 0.84 | 0.88 | 1.01 | 2.94 | 3.96 | 2.88 | 4.10 | 2.72 | 4.03 |
| 10 | 0.64 | 0.80 | 0.58 | 0.71 | 0.44 | 0.62 | 2.89 | 1.15 | 2.93 | 1.30 | 2.88 | 0.98 |
| 11 | 0.66 | 0.97 | 0.54 | 0.84 | 0.39 | 1.02 | 1.92 | 4.72 | 1.88 | 4.83 | 1.80 | 4.70 |
| 12 | 0.65 | 1.06 | 0.54 | 0.89 | 0.41 | 1.04 | 0.96 | 2.05 | 1.10 | 2.13 | 1.07 | 2.15 |
| 13 | 0.48 | 0.45 | 0.43 | 0.32 | 0.36 | 0.28 | 1.67 | 1.28 | 1.50 | 1.20 | 1.53 | 1.32 |
| 14 | 1.61 | 2.42 | 1.58 | 2.30 | 1.60 | 2.23 | ||||||
| 15 | 1.92 | 3.45 | 2.08 | 3.30 | 1.90 | 3.28 | ||||||
| 16 | 1.63 | 1.28 | 1.58 | 1.30 | 1.66 | 1.19 | ||||||
| Medial value | 0.65 | 0.72 | 0.58 | 0.66 | 0.52 | 0.62 | 1.65 | 1.82 | 1.58 | 1.82 | 1.63 | 1.89 |
- 1. Barrack RL, Paprosky W, Butler RA, Palafox A, Szuszczewicz E, Myers L. Patients' perception of pain after total hip arthroplasty. J Arthroplasty 2000;15:590–6.ArticlePubMedPMC
- 2. Domb B, Hostin E, Mont MA, Hungerford DS. Cortical strut grafting for enigmatic thigh pain following total hip arthroplasty. Orthopedics 2000;23:21–4.ArticlePubMed
- 3. Lavernia C, D'apuzzo M, Hernandez VH, Lee DJ. Patient-perceived outcomes in thigh pain after primary arthroplasty of the hip. Clin Orthop Relat Res 2005;441:268–73.ArticlePubMedPMC
- 4. Campbell AC, Rorabeck CH, Bourne RB, Chess D, Nott L. Thigh pain after cementless hip arthroplasty. Annoyance or ill omen. J Bone Joint Surg Br 1992;74:63–6.ArticlePubMedPMC
- 5. Kim YH, Kim VE. Uncemented porous-coated anatomic total hip replacement. Results at six years in a consecutive series. J Bone Joint Surg Br 1993;75:6–13.ArticlePubMedPMC
- 6. Bourne RB, Rorabeck CH, Patterson JJ, Guerin J. Tapered titanium cementless total hip replacements: a 10- to 13-year followup study. Clin Orthop Relat Res 2001;393:112–20.ArticlePubMedPMC
- 7. D'Lima DD, Oishi CS, Petersilge WJ, Colwell CW Jr, Walker RH. 100 cemented versus 100 noncemented stems with comparison of 25 matched pairs. Clin Orthop Relat Res 1998;348:140–8.Article
- 8. Engh CA, Bobyn JD, Glassman AH. Porous-coated hip replacement. The factors governing bone ingrowth, stress shielding, and clinical results. J Bone Joint Surg Br 1987;69:45–55.ArticlePubMed
- 9. Brown TE, Larson B, Shen F, Moskal JT. Thigh pain after cementless total hip arthroplasty: evaluation and management. J Am Acad Orthop Surg 2002;10:385–92.ArticlePubMed
- 10. Skinner HB, Curlin FJ. Decreased pain with lower flexural rigidity of uncemented femoral prostheses. Orthopedics 1990;13:1223–8.ArticlePubMed
- 11. Maloney WJ, Harris WH. Comparison of a hybrid with an uncemented total hip replacement. A retrospective matched-pair study. J Bone Joint Surg Am 1990;72:1349–52.ArticlePubMed
- 12. Namba RS, Keyak JH, Kim AS, Vu LP, Skinner HB. Cementless implant composition and femoral stress. A finite element analysis. Clin Orthop Relat Res 1998;347:261–7.Article
- 13. Barrack RL, Jasty M, Bragdon C, Haire T, Harris WH. Thigh pain despite bone ingrowth into uncemented femoral stems. J Bone Joint Surg Br 1992;74:507–10.ArticlePubMed
- 14. Vresilovic EJ, Hozack WJ, Rothman RH. Incidence of thigh pain after uncemented total hip arthroplasty as a function of femoral stem size. J Arthroplasty 1996;11:304–11.ArticlePubMed
- 15. Burkart BC, Bourne RB, Rorabeck CH, Kirk PG. Thigh pain in cementless total hip arthroplasty. A comparison of two systems at 2 years' follow-up. Orthop Clin North Am 1993;24:645–53.PubMed
- 16. Cooper RR, Milgram JW, Robinson RA. Morphology of the osteon. An electron microscopic study. J Bone Joint Surg Am 1966;48:1239–71.ArticlePubMed
- 17. Jo WL, Lee YK, Ha YC, Park MS, Lyu SH, Koo KH. Frequency, developing time, intensity, duration, and functional score of thigh pain after cementless total hip arthroplasty. J Arthroplasty 2016;31:1279–82.ArticlePubMed
- 18. Hailer NP, Garellick G, Kärrholm J. Uncemented and cemented primary total hip arthroplasty in the Swedish Hip Arthroplasty Register. Acta Orthop 2010;81:34–41.ArticlePubMedPMC
- 19. Hwang SK, Her MS, Joe TY. Total hip arthroplasty with F2L Multineck cementless femoral stem. J Korean Hip Soc 2007;19:129–35.Article
- 20. Hedley AK, Gruen TA, Borden LS, Hungerford DS, Habermann E, Kenna RV. Two-year follow-up of the PCA noncemented total hip replacement. Hip 1987;225–50.PubMed
- 21. von Recum AF. Handbook of biomaterials evaluation: scientific, technical, and clinical testing of implant materials. 2nd ed. Philadelphia: Taylor & Francis; 1999.
- 22. Ivanusic JJ, Sahai V, Mahns DA. The cortical representation of sensory inputs arising from bone. Brain Res 2009;1269:47–53.ArticlePubMed
References
Figure & Data
References
Citations
Citations to this article as recorded by 
- Hydroxyapatite ceramic-coated femoral components in younger patients followed up for 27 to 32 years
Piyush K. Upadhyay, Nirav Shah, Vishal Kumar, Saqeb B. Mirza
Bone & Joint Open.2024; 5(4): 286. CrossRef
 PubReader
 ePub Link
 Cite
Cite

