 E-Submission
PubMed Central, CAS, DOAJ, KCI

Articles
- Page Path
- HOME > J Yeungnam Med Sci > Volume 40(4); 2023 > Article
-
Original article
Association between fatty liver disease and hearing impairment in Korean adults: a retrospective cross-sectional study -
Da Jung Jung

-
Journal of Yeungnam Medical Science 2023;40(4):402-411.
DOI: https://doi.org/10.12701/jyms.2023.00304
Published online: June 26, 2023
Department of Otorhinolaryngology-Head and Neck Surgery, Kyungpook National University Hospital, School of Medicine, Kyungpook National University, Daegu, Korea
- Corresponding author: Da Jung Jung, MD, PhD Department of Otorhinolaryngology-Head and Neck Surgery, Kyungpook National University Hospital, School of Medicine, Kyungpook National University, 130 Dongdeok-ro, Jung-gu, Daegu 41944, Korea Tel: +82-53-420-5785 • Fax: +82-53-423-4524 • E-mail: wjddk0731@naver.com
Copyright © 2023 Yeungnam University College of Medicine, Yeungnam University Institute of Medical Science
This is an Open Access article distributed under the terms of the Creative Commons Attribution Non-Commercial License (http://creativecommons.org/licenses/by-nc/4.0/) which permits unrestricted non-commercial use, distribution, and reproduction in any medium, provided the original work is properly cited.
- 2,329 Views
- 37 Download
Abstract
-
Background
- We hypothesized that fatty liver disease (FLD) is associated with a high prevalence of hearing loss (HL) owing to metabolic disturbances. This study aimed to evaluate the association between FLD and HL in a large sample of the Korean population.
-
Methods
- We used a dataset of adults who underwent routine voluntary health checkups (n=21,316). Fatty liver index (FLI) was calculated using Bedogni’s equation. The patients were divided into two groups: the non-FLD (NFLD) group (n=18,518, FLI <60) and the FLD group (n=2,798, FLI ≥60). Hearing thresholds were measured using an automatic audiometer. The average hearing threshold (AHT) was calculated as the pure-tone average at four frequencies (0.5, 1, 2, and 3 kHz). HL was defined as an AHT of >40 dB.
-
Results
- HL was observed in 1,370 (7.4%) and 238 patients (8.5%) in the NFLD and FLD groups, respectively (p=0.041). Compared with the NFLD group, the odds ratio for HL in the FLD group was 1.16 (p=0.040) and 1.46 (p<0.001) in univariate and multivariate logistic regression analyses, respectively. Linear regression analyses revealed that FLI was positively associated with AHT in both univariate and multivariate analyses. Analyses using a propensity score-matched cohort showed trends similar to those using the total cohort.
-
Conclusion
- FLD and FLI were associated with poor hearing thresholds and HL. Therefore, active monitoring of hearing impairment in patients with FLD may be helpful for early diagnosis and treatment of HL in the general population.
- Hearing loss (HL) is an important global health problem associated with quality of life and various adverse outcomes. The World Health Organization (WHO) estimates that approximately 430 million patients suffer from HL [1]. The prevalence of HL is steadily increasing with aging of the population, the increasing prevalence of various comorbidities, and the use of earphones. Further, the WHO has projected that the number of patients with HL will increase to 700 million by 2050 [1]. Therefore, the identification and treatment of risk factors for HL are important to decrease the prevalence or severity of HL. Noise exposure, age, and various ear diseases are well-known risk factors for HL. However, as the prevalence of chronic diseases, such as hypertension and diabetes mellitus (DM), is increasing, recent studies have focused on the association between various medical problems and HL. Previous epidemiologic studies have shown a positive correlation between metabolic disturbances and HL in the general population [2-6].
- Fatty liver disease (FLD) is a metabolic disease characterized by accumulation of fat droplets within hepatocytes. Previous studies have shown an association between FLD and liver problems such as hepatitis, liver cirrhosis, and hepatocellular carcinoma [7]. Moreover, FLD is associated with poor patient survival. Furthermore, recent studies have shown associations between FLD and various nonhepatic metabolic disturbances [8-15]. We hypothesized that FLD is associated with a high prevalence of HL due to metabolic disturbances. Therefore, this study aimed to evaluate the association between FLD and HL in a large sample of the Korean population.
Introduction
- Ethical statements: This study was approved by the Institutional Review Board (IRB) of Kyungpook National University Hospital (IRB No: 2015-06-003), which waived the need for informed consent because the data were anonymized and deidentified before analysis.
- 1. Study population
- Our study used a dataset of adults who underwent routine voluntary health checkups at a tertiary medical center between June 2008 and April 2014. Of the 22,480 adults (aged ≥18 years), we excluded participants with insufficient laboratory or hearing threshold data (n=143), or those with positive test results for hepatitis B surface antigen or hepatitis C antibodies (n=1,021). Finally, 21,316 patients were included in the study.
- 2. Study variables
- The following clinical and laboratory data were collected: age; sex; body mass index (BMI, kg/m2); waist circumference (WC, cm); systolic blood pressure (SBP, mmHg); diastolic blood pressure (DBP, mmHg); platelet count (cells/mm3); gamma-glutamyl transferase (GGT, U/L), serum creatinine (mg/dL), high-sensitivity C-reactive protein (hs-CRP, mg/dL), hemoglobin (mg/dL), fasting blood glucose (mg/dL), glycated hemoglobin (HbA1c, %), aspartate transaminase (AST, U/L), alanine transaminase (ALT, U/L), total cholesterol (mg/dL), triglycerides (TG, mg/dL), and high-density lipoprotein (HDL) cholesterol (mg/dL) levels; fatty liver index (FLI); and hearing thresholds.
- FLI was calculated using Bedogni’s equation as follows [16]:
- FLI=(e0.953 × loge (TG)+0.139×BMI+0.718×loge (GGT)+0.053×WC−15.745)/(1+e0.953×loge (TG)+0.139×BMI+0.718×loge (GGT)+0.053×WC−15.745)×100
- FLI ranges from 0 to 100. Previous studies have shown high concordance between FLI and the gold-standard methods for diagnosing FLD [16,17]. In this study, the patients were divided into two groups according to a cutoff FLI of 60. We defined the non-FLD (NFLD) group as patients with FLI of <60 and the FLD group as those with FLI of ≥60, based on a previous study [16]. In addition, metabolic dysfunction-associated FLD (MAFLD) was defined according to a previous study [18]. The patients with FLD according to FLI were divided into three groups as follows: high BMI type, patients with BMI of ≥23 kg/m2; DM type, patients with DM; and lean type, BMI of <23 kg/m2 and having two or more metabolic factors (WC, ≥90 cm for male and ≥80 cm for female; blood pressure, ≥130/85 mmHg or antihypertensive drug treatment; plasma TG, ≥150 mg/dL or specific drug treatment; plasma HDL cholesterol, <40 mg/dL for male and <50 mg/dL for female or specific drug treatment; fasting glucose levels, 100–125 mg/dL or HbA1c 5.7%–6.4%; and hs-CRP level, >0.2 mg/dL).
- Hearing thresholds were measured using an automatic audiometer at 0.5, 1, 2, 3, 4, and 6 kHz. For both ears of each participant, low-frequency (Low-Freq), mid-frequency (Mid-Freq), and high-frequency (High-Freq) values were obtained by calculating the pure-tone averages at 0.5 and 1 kHz, 2 and 3 kHz, and 4 and 6 kHz, respectively. In this study, the average hearing threshold (AHT) was calculated as the pure-tone average at four frequencies (0.5, 1, 2, and 3 kHz). HL was defined as an AHT of >40 dB.
- BMI was calculated as body weight divided by height squared. DM was defined as a self-reported history of DM or a fasting glucose level of ≥126 mg/dL. Hypertension was defined as an SBP of ≥140 mmHg, DBP of ≥90 mmHg, a self-reported history of hypertension, or use of antihypertensive drugs.
- 3. Statistical analysis
- Data were analyzed using the statistical software SAS (ver. 9.4; SAS Institute, Cary, NC, USA). Categorical variables are expressed as counts (percentages). Continuous variables are expressed as mean±standard deviation or standard error. Pearson chi-square test or Fisher exact tests were used to analyze categorical variables. For continuous variables, the means were compared using t-tests. Associations between two continuous variables were evaluated using Pearson correlation or partial correlation analyses. Linear regression analysis was performed to determine independent predictors of AHT. Logistic regression analyses were used to estimate the odds ratios (ORs) and 95% confidence intervals (CIs), which were then used to assess the relationship between FLD and HL. Multivariate analyses were adjusted for age; sex; DM; hypertension; platelet count; and total cholesterol, HDL cholesterol, AST, ALT, creatinine, hs-CRP, and hemoglobin levels. BMI, WC, and GGT levels were not included in the multivariate model because they were used for the FLI calculation.
- Most baseline characteristics differed between the NFLD and FLD groups. To adjust for these differences, we estimated the propensity scores using logistic regression models with the following variables: age, sex, DM, hypertension, SBP, DBP, platelet count, total cholesterol, HDL cholesterol, AST, ALT, creatinine, hs-CRP, hemoglobin, and fasting glucose. Participants in the NFLD group were matched with those in the FLD group using 1:1 nearest neighbor matching based on propensity scores without replacement and a matching tolerance (caliper) of 0.01. Statistical significance was set at p<0.05.
Methods
- 1. Participant clinical characteristics
- The NFLD and FLD groups included 18,518 and 2,798 patients, respectively. The FLI scores in the NFLD and FLD groups were 20.1±16.2 and 74.9±10.1, respectively (p<0.001). The baseline characteristics of the patients are shown in Table 1. The participants in the NFLD group were older than those in the FLD group. The prevalence of male sex, DM, and hypertension was higher in the FLD group than in the NFLD group. Most laboratory values were higher in the FLD group than in the NFLD group.
- 2. Association between fatty liver disease and heariing loss or hearing thresholds
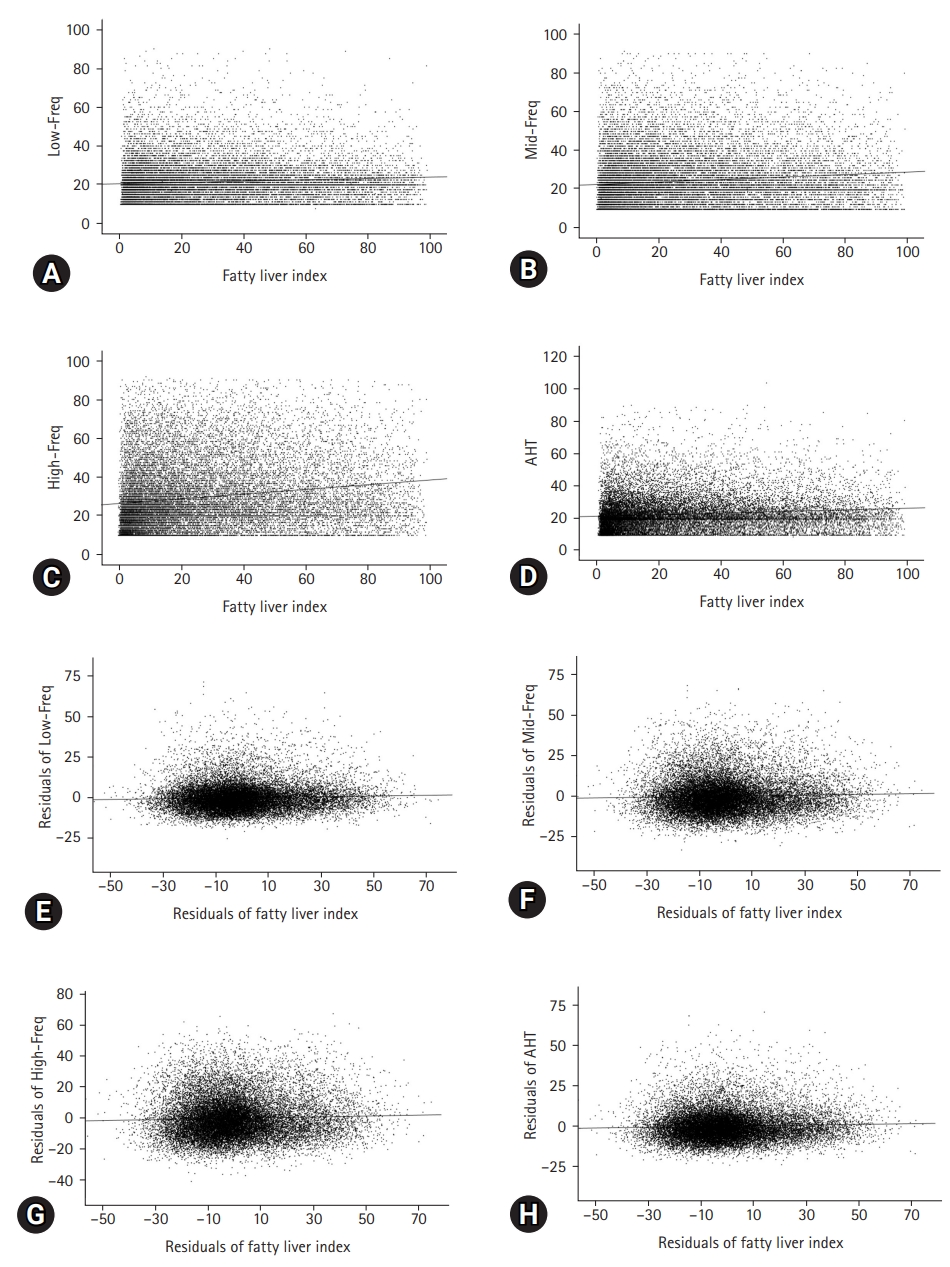
- HL was observed in 1,370 (7.4%) and 238 patients (8.5%) in the NFLD and FLD groups, respectively (p=0.041). Compared with the NFLD group, the ORs for HL in the FLD group were 1.16 (95% CI, 1.01–1.34) and 1.46 (95% CI, 1.22–1.74) in the univariate and multivariate logistic regression analyses, respectively (Table 2). Pearson correlation analyses showed that the correlation coefficients between FLI and Low-Freq, Mid-Freq, High-Freq, and AHTs were 0.088, 0.116, 0.172, and 0.108, respectively (Fig. 1, all p<0.001). Partial correlation coefficients with adjustment for covariates between the FLI and Low-Freq, Mid-Freq, High-Freq, and AHTs were 0.045, 0.035, 0.038, and 0.043, respectively (Fig. 1, all p<0.001).
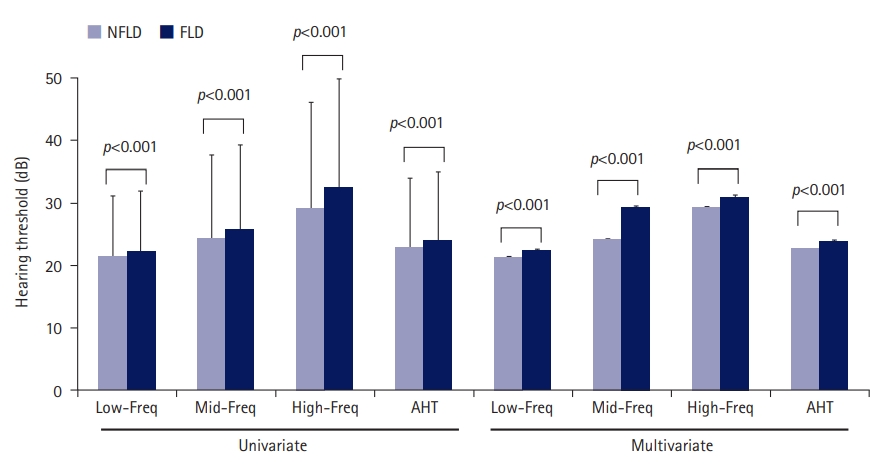
- Linear regression analyses revealed that the FLI was positively associated with AHT in both univariate and multivariate analyses (Table 3). Low-Freq, Mid-Freq, High-Freq, and AHT were 21.4±9.8 dB, 24.3±13.3 dB, 29.2±16.9 dB, and 22.9±11.1 dB and 22.2±9.7 dB, 25.8±13.5 dB, 32.5±17.4 dB, and 24.0±11.0 dB in the NFLD and in FLD groups, respectively (p<0.001 for comparison of four hearing thresholds between the NFLD and FLD groups) (Fig. 2). Multivariate analysis showed the same trends as the univariate analyses.
- In addition, we evaluated the association between HbA1c levels, as an indicator of insulin resistance, and hearing outcomes. The Pearson correlation coefficients between HbA1c levels and Low-Freq, Mid-Freq, High-Freq, and AHT were 0.160, 0.187, 0.210, and 0.184, respectively (p<0.001 for all). The mean HbA1c values in patients with and without HL were 6.0%±1.0% and 5.7%±0.7%, respectively (p<0.001). HbA1c, an indicator of insulin resistance, is associated with hearing threshold. There were 259 patients with DM (14.8%) and 1,349 patients without DM (6.9%) who had HL (p<0.001). The OR for HL in patients with DM was 2.35 (95% CI, 2.03–2.71; p<0.001). In multivariate analysis, the OR for HL in patients with DM was 1.19 (95% CI, 1.01–1.40; p=0.037).
- Overall, 2,790 patients (13.1%) had MAFLD, and based on FLI, eight patients were excluded from those with FLD. According to MAFLD type, 43 (0.2%), 2,227 (10.4%), and 520 patients (2.4%) were classified as lean, high BMI, and DM types, respectively. According to MAFLD type, there were seven patients (16.3%) classified as lean type, 156 (9.7%) classified as high BMI type, and 72 (13.8%) classified as DM type who had HL. Based on univariate logistic regression analysis, the ORs for HL according to MAFLD type were 2.43 (95% CI, 1.08–5.47; p=0.032) for lean type, 0.94 (95% CI, 0.79–1.12; p=0.488) for high BMI type, and 2.01 (95% CI, 1.56–2.59; p<0.001) for DM type. Multivariate analysis showed that the ORs for HL according to MAFLD type were 1.71 (95% CI, 0.66–4.46; p=0.269) for lean type, 1.50 (95% CI, 1.23–1.83; p<0.001) for high BMI type, and 1.60 (95% CI, 1.20–2.14; p<0.001) for DM type.
- 3. Analyses using propensity score-matched cohort
- Of the 2,798 participants in the FLD group, 2,329 were matched with participants from the NFLD group. Before the groups were matched, the standardized mean difference was 1.132; however, the value decreased to 0.001 after matching. Before matching, the mean propensity scores of the FLD and NFLD groups were 0.386 and 0.093, respectively. After matching, the corresponding values were 0.311 and 0.312. The estimated distribution of the propensity scores was similar after matching (Fig. 3). No significant differences in baseline characteristics, except for age, AST level, ALT level, and the four variables for calculation of the FLI, were observed between the two groups (Table 4).
- In the propensity score-matched cohort, 164 (7.0%) and 203 (8.7%) patients in the NFLD and FLD groups, respectively, had HL (p=0.034). The FLI in the NFLD and FLD groups was 35.1±15.1 and 73.9±9.8, respectively (p<0.001). In univariate logistic regression analysis, the OR for HL in the FLD group was 1.26 (95% CI, 1.02–1.56). The multivariate analysis adjusted for age, AST level, and ALT level showed that the OR for HL in the FLD group was 1.47 (95% CI, 1.16–1.86) compared with that in the NFLD group. Except for High-Freq in the univariate analysis, Low-Freq, Mid-Freq, High-Freq, and AHT were higher in the FLD group than in the NFLD group (Table 5).
Results
- Our study included 21,316 patients who had undergone health checkups. We performed various analyses using total and propensity score-matched cohorts. The risk of HL in the FLD group was greater than that in the NFLD group in both the univariate and multivariate analyses. The FLI positively correlated with all four hearing thresholds (Low-Freq, Mid-Freq, High-Freq, and AHT).
- FLD is one of the most common liver diseases that can be diagnosed definitively by imaging (e.g., ultrasound) or liver pathology based on the accumulation of fat in the liver. However, these two diagnostic methods cause patient discomfort, incur additional costs, and are time-consuming. Previous studies have attempted to predict FDL based on laboratory findings using various equations [16,17,19-25]. Although simple laboratory findings such as AST and ALT levels have limited sensitivity and specificity for diagnosing FLD, previous studies have shown that equations that include various parameters have favorable predictability for FLD [16,17,19-25]. In this study, FLI was defined as a continuous variable derived from an equation using BMI, GGT level, WC, and TG level, while the FLD group was defined as a categorical variable based on a cutoff FLI score of 60 [16,17]. FLD is a well-known hepatic manifestation of metabolic disturbances. Various metabolic diseases can lead to FLD. FLD is associated with various metabolic disturbances. Previous studies have demonstrated a strong association between insulin resistance and fat accumulation in the liver [8,9,11]. The prevalence of type 2 DM is higher in patients with FLD than in those without [10]. Conversely, the prevalence of FLD is higher in patients with DM than in those without [12,13]. Kang et al. [14] evaluated a representative sample and found a positive correlation between FLD or FLI and low-grade albuminuria. Another study suggested that renal dysfunction in FLD can develop because of the influence of cardiometabolic diseases or disturbances in renal vasoregulation [15]. In our study, there were significant differences in the baseline laboratory data between the two groups. Although these differences may have been evident owing to the large sample size, they may be associated with inherent changes following insulin resistance. Therefore, we performed propensity score matching to decrease differences in baseline characteristics between the two groups.
- Risk factors for sensorineural HL include advanced age, noise, medication, trauma, and infection. Recent studies have shown that an increase in the prevalence of HL is associated with an increase in the incidence of various chronic diseases. Recent population-based studies have indicated an association between HL and DM, and HL and hypertension [2,10,12,13]. Although the definite pathophysiology of HL in patients with these diseases is not fully understood, previous studies have suggested that micro- or macrovascular injuries in the cochlea play an important role in HL [2]. Sensory receptors and supporting cells in the cochlea and stria vascularis are capable of insulin signaling via insulin receptors and glucose transporters. Thus, HL may be associated with insulin resistance, as reported previously [6]. Rim et al. [5] reported a positive correlation between several components of metabolic syndrome and the incidence of sensorineural HL in a large sample of 94,223 patients. Using a representative sample, Kang et al. [4] showed that HbA1c level, which is an indicator of insulin resistance, was associated with hearing impairment. Another study showed a positive correlation between visceral fat area and HL [3]. FLD is a risk factor for metabolic disturbances, including insulin resistance, which may directly or indirectly influence HL development. In our study, hearing thresholds and HL were associated with FLI as a continuous variable and the FLD group as a categorical variable. Furthermore, analyses using the propensity score-matched cohort showed similar trends to those using the total cohort.
- Our study has several limitations. First, this was a retrospective study that analyzed datasets generated during voluntary health checkups, regardless of medical necessity. Second, FLD was defined using an equation from Bedogni et al. [16] and was not confirmed by imaging or pathological findings. However, previous studies demonstrated the high predictability of the FLD equation [26-29]. Third, baseline characteristics differed between the two groups. We attempted to minimize differences in baseline characteristics through multivariate analyses and/or using a propensity score-matched cohort. However, it was difficult to eliminate differences in baseline characteristics owing to inherent differences, such as insulin resistance, between the two groups. Fourth, the dataset used in this study did not include data on alcohol intake, occupation, medical history of ear diseases, or medications. Thus, the possibility of alcoholic FLD in patients with FLD cannot be excluded. However, a previous study using a representative sample indicated a low prevalence of heavy alcohol intake, and the lower prevalence of alcoholic FLD compared to nonalcoholic FLD may attenuate the possibility of alcoholic FLD in our cohort [30,31]. We also evaluated MAFLD using the definition from a previous study [18]. Patients with FLD according to FLI coincided with those with MAFLD, excluding eight patients. Our results showed a weak association between the lean type and HL and a similar association between the high BMI or DM type and HL. However, the weak statistical association for the lean type may be related to the small sample size of this category, and further studies are needed to evaluate differences according to MAFLD types. However, occupation, use of medications such as aspirin or aminoglycosides, and medical history of ear diseases can be important confounding factors for HL. Fifth, we evaluated hearing impairment using hearing thresholds only. Additional data, such as speech discrimination, will not only help confirm hearing impairment but also understand its effect on daily life. Further prospective studies that include follow-up data, additional confounding factors, and speech discrimination are required to overcome these limitations.
- In this study, FLD and FLI were associated with poor thresholds and HL. Therefore, active monitoring of hearing impairment in patients with FLD may be helpful for early diagnosis and treatment of HL in the general population.
Discussion
-
Conflicts of interest
No potential conflict of interest relevant to this article was reported.
-
Funding
This research was supported by a grant of the Korea Health Technology R&D Project through the Korea Health Industry Development Institute (KHIDI), funded by the Ministry of Health & Welfare, Republic of Korea (grant No: HR22C1832).
Notes


| Characteristic | NFLD group | FLD group | p-valuea) |
|---|---|---|---|
| No. of patients | 18,518 | 2,798 | |
| Age (yr) | 50.7±12.1 | 50.1±10.8 | 0.019 |
| Male sex | 9,077 (49.0) | 2,486 (88.8) | <0.001 |
| Body mass index (kg/m2) | 23.2±2.6 | 27.9±3.0 | <0.001 |
| Waist circumference (cm) | 78.4±7.6 | 91.9±6.8 | <0.001 |
| Gamma-glutamyl transferase (U/L) | 28.2±28.5 | 98.2±140.4 | <0.001 |
| Triglycerides (mg/dL) | 109±62 | 256±172 | <0.001 |
| Diabetes mellitus (%) | 1,230 (6.6) | 520 (18.6) | <0.001 |
| Hypertension (%) | 2,699 (14.6) | 899 (32.1) | <0.001 |
| Fasting blood glucose (mg/dL) | 92.4±20.0 | 103.4±28.7 | <0.001 |
| Total cholesterol (mg/dL) | 196±35 | 216±42 | <0.001 |
| High-density lipoprotein (mg/dL) | 58±15 | 48±12 | <0.001 |
| Systolic blood pressure (mmHg) | 117±14 | 126±13 | <0.001 |
| Diastolic blood pressure (mmHg) | 74±10 | 81±10 | <0.001 |
| Aspartate transaminase (U/L) | 24±13 | 35±28 | <0.001 |
| Alanine transaminase (U/L) | 23±16 | 48±40 | <0.001 |
| Serum creatinine (mg/dL) | 0.87±0.22 | 0.98±0.19 | <0.001 |
| hs-CRP (mg/dL) | 0.15±0.73 | 0.27±2.00 | <0.001 |
| Hemoglobin (mg/dL) | 14.1±1.5 | 15.4±1.3 | <0.001 |
| Platelet count (cells/mm3) | 266±62 | 272±63 | 0.019 |
Values are presented as number only, mean±standard deviation, or number (%).
FLD, fatty liver disease; NFLD, non-FLD; hs-CRP, high-sensitivity C-reactive protein.
a) p-values were determined using t-tests for continuous variables and Pearson chi-square test or Fisher exact tests for categorical variables.
| Independent variable |
Univariate |
Multivariate |
||
|---|---|---|---|---|
| OR (95% CI) | p-valuea) | OR (95% CI) | p-valuea) | |
| FLD group (reference, NFLD group) | 1.16 (1.01–1.34) | 0.040 | 1.46 (1.22–1.74) | <0.001 |
| Age | 1.14 (1.13–1.14) | <0.001 | 1.14 (1.13–1.14) | <0.001 |
| Sex (reference, male sex) | 1.03 (0.93–1.14) | 0.539 | 0.80 (0.67–0.95) | 0.013 |
| Diabetes mellitus | 2.34 (2.03–2.70) | <0.001 | 0.93 (0.79–1.10) | 0.406 |
| Hypertension | 2.13 (1.90–2.38) | <0.001 | 1.05 (0.92–1.19) | 0.508 |
| Total cholesterol (per 1 mg/dL increase) | 1.00 (1.00–1.01) | 0.001 | 1.00 (1.00–1.00) | 0.563 |
| HDL cholesterol (per 1 mg/dL increase) | 0.99 (0.98–0.99) | <0.001 | 0.99 (0.99–0.99) | <0.001 |
| Aspartate transaminase (per 1 U/L increase) | 1.01 (1.00–1.01) | <0.001 | 1.01 (1.00–1.01) | 0.001 |
| Alanine transaminase (per 1 U/L increase) | 1.00 (0.99–1.00) | 0.462 | 0.99 (0.99–1.00) | 0.032 |
| Serum creatinine (per 1 mg/dL increase) | 1.00 (0.80–1.26) | 0.988 | 0.57 (0.40–0.80) | 0.001 |
| hs-CRP (per 1 mg/dL increase) | 1.06 (1.01–1.11) | 0.014 | 1.02 (0.98–1.06) | 0.321 |
| Hemoglobin (per 1 mg/dL increase) | 0.90 (0.88–0.93) | <0.001 | 0.95 (0.90–1.00) | 0.038 |
| Platelet count (per 1 cell/mm3 increase) | 1.00 (1.00–1.01) | 0.001 | 1.00 (1.00–1.00) | 0.008 |
OR, odds ratio; CI, confidence interval; FLD, fatty liver disease; NFLD, non-FLD; HDL, high-density lipoprotein; hs-CRP, high-sensitivity C-reactive protein.
a) The dependent variable was hearing loss, and multivariate analysis was adjusted for the following FLD groups: age, sex, diabetes mellitus, hypertension, platelet count, total cholesterol, HDL cholesterol, aspartate transaminase, alanine transaminase, serum creatinine, hs-CRP, and hemoglobin.
| Independent variable |
Univariate |
Multivariate |
||
|---|---|---|---|---|
| NS-β±SE | p-valuea) | NS-β±SE | p-valuea) | |
| Fatty liver index | 0.049±0.003 | <0.001 | 0.022±0.004 | <0.001 |
| Age | 0.524±0.005 | <0.001 | 0.515±0.006 | <0.001 |
| Sex (reference, male sex) | –0.527±0.152 | 0.001 | –1.119±0.208 | <0.001 |
| Diabetes mellitus | 5.580±0.273 | <0.001 | 0.185±0.236 | 0.433 |
| Hypertension | 4.219±0.200 | <0.001 | 0.316±0.174 | 0.069 |
| Total cholesterol (per 1 mg/dL increase) | 0.017±0.002 | <0.001 | –0.011±0.002 | <0.001 |
| HDL cholesterol (per 1 mg/dL increase) | –0.073±0.005 | <0.001 | –0.031±0.005 | <0.001 |
| Aspartate transaminase (per 1 U/L increase) | 0.045±0.005 | <0.001 | 0.016±0.006 | 0.008 |
| Alanine transaminase (per 1 U/L increase) | 0.008±0.003 | 0.017 | –0.009±0.005 | 0.072 |
| Serum creatinine (per 1 mg/dL increase) | 0.275±0.341 | 0.421 | –2.194±0.345 | <0.001 |
| hs-CRP (per 1 mg/dL increase) | 0.454±0.076 | <0.001 | 0.118±0.063 | 0.060 |
| Hemoglobin (per 1 mg/dL increase) | –0.300±0.048 | <0.001 | –0.335±0.060 | <0.001 |
| Platelet count (per 1 cell/mm3 increase) | 0.008±0.001 | <0.001 | 0.007±0.001 | <0.001 |
NS-β, non-standardized β; SE, standard error; HDL, high-density lipoprotein; hs-CRP, high-sensitivity C-reactive protein.
a) The dependent variable was the average hearing threshold, and multivariate analysis was adjusted for fatty liver index, age, sex, diabetes mellitus, hypertension, platelet count, total cholesterol; HDL cholesterol, aspartate transaminase, alanine transaminase, serum creatinine, hs-CRP, and hemoglobin.
| Variable | NFLD group | FLD group | p-valuea) |
|---|---|---|---|
| No. of patients | 2,329 | 2,329 | |
| Age (yr) | 51.4±11.2 | 50.7±10.9 | 0.037 |
| Male sex | 2,049 (88.0) | 2,025 (86.9) | 0.309 |
| Body mass index (kg/m2) | 24.5±2.2 | 27.9±3.0 | <0.001 |
| Waist circumference (cm) | 83.0±5.7 | 91.8±6.7 | <0.001 |
| Gamma-glutamyl transferase (U/L) | 44.4±46.4 | 90.7±110.5 | <0.001 |
| Triglycerides (mg/dL) | 146±69 | 246±151 | <0.001 |
| Diabetes mellitus (%) | 400 (17.2) | 375 (16.1) | 0.345 |
| Hypertension (%) | 710 (30.5) | 685 (29.4) | 0.424 |
| Fasting blood glucose (mg/dL) | 102.5±36.3 | 101.2±24.1 | 0.160 |
| Total cholesterol (mg/dL) | 212±38 | 212±38 | 0.936 |
| High-density lipoprotein (mg/dL) | 48±11 | 48±12 | 0.329 |
| Systolic blood pressure (mmHg) | 126±13 | 125±13 | 0.215 |
| Diastolic blood pressure (mmHg) | 80±9 | 80±10 | 0.285 |
| Aspartate transaminase (U/L) | 30±27 | 32±19 | 0.043 |
| Alanine transaminase (U/L) | 39±30 | 40±24 | 0.035 |
| Serum creatinine (mg/dL) | 0.99±0.28 | 0.98±0.19 | 0.172 |
| hs-CRP (mg/dL) | 0.21±0.88 | 0.26±2.15 | 0.314 |
| Hemoglobin (mg/dL) | 15.4±1.2 | 15.3±1.3 | 0.397 |
| Platelet count (cells/mm3) | 271±69 | 272±64 | 0.987 |
Values are presented as number only, mean±standard deviation, or number (%).
FLD, fatty liver disease; NFLD, non-FLD; hs-CRP, high-sensitivity C-reactive protein.
a) p-values were determined using t-tests for continuous variables and Pearson chi-square test or Fisher exact tests for categorical variables.
| Variable |
Univariate |
Multivariate |
||||
|---|---|---|---|---|---|---|
| NFLD group | FLD group | p-valuea) | NFLD group | FLD group | p-valuea) | |
| Low-Freq | 21.4±9.6 | 22.4±9.8 | <0.001 | 21.2±0.2 | 22.4±0.2 | <0.001 |
| Mid-Freq | 25.1±13.5 | 26.2±13.6 | 0.006 | 24.8±0.3 | 26.2±0.2 | <0.001 |
| High-Freq | 32.1±17.3 | 33.0±17.5 | 0.067 | 31.7±0.3 | 33.3±0.3 | <0.001 |
| AHT | 23.2±10.9 | 24.3±11.1 | <0.001 | 23.0±0.2 | 24.0±0.2 | <0.001 |
Values are presented as mean±standard deviation for univariate analysis and mean±standard error for multivariate analysis.
FLD, fatty liver disease; NFLD, non-FLD; Low-Freq, low-frequency threshold; Mid-Freq, middle-frequency threshold; High-Freq, high-frequency threshold; AHT, average hearing threshold.
a) p-values were determined using t-tests for univariate analysis, and analysis of covariance was used for multivariate analysis. Multivariate analysis was adjusted for age, aspartate transaminase levels, and alanine transaminase levels.
- 1. World Health Organization (WHO). Deafness and hearing loss [Internet]. Geneva: WHO; 2023 [cited 2023 Jan 18]. https://www.who.int/news-room/fact-sheets/detail/deafness-and-hearing-loss/.
- 2. Przewoźny T, Gójska-Grymajło A, Kwarciany M, Gąsecki D, Narkiewicz K. Hypertension and cochlear hearing loss. Blood Press 2015;24:199–205.ArticlePubMed
- 3. Kang SH, Jung DJ, Choi EW, Park JW, Cho KH, Lee KY, et al. Visceral fat area determined using bioimpedance analysis is associated with hearing loss. Int J Med Sci 2015;12:946–51.ArticlePubMedPMC
- 4. Kang SH, Jung DJ, Cho KH, Park JW, Lee KY, Do JY. Association between HbA1c level and hearing impairment in a nondiabetic adult population. Metab Syndr Relat Disord 2016;14:129–34.ArticlePubMed
- 5. Rim HS, Kim MG, Park DC, Kim SS, Kang DW, Kim SH, et al. Association of metabolic syndrome with sensorineural hearing loss. J Clin Med 2021;10:4866.ArticlePubMedPMC
- 6. Samocha-Bonet D, Wu B, Ryugo DK. Diabetes mellitus and hearing loss: a review. Ageing Res Rev 2021;71:101423.ArticlePubMed
- 7. Ahmed A, Wong RJ, Harrison SA. Nonalcoholic fatty liver disease review: diagnosis, treatment, and outcomes. Clin Gastroenterol Hepatol 2015;13:2062–70.ArticlePubMed
- 8. Chalasani N, Deeg MA, Persohn S, Crabb DW. Metabolic and anthropometric evaluation of insulin resistance in nondiabetic patients with nonalcoholic steatohepatitis. Am J Gastroenterol 2003;98:1849–55.ArticlePubMed
- 9. Musso G, Gambino R, De Michieli F, Cassader M, Rizzetto M, Durazzo M, et al. Dietary habits and their relations to insulin resistance and postprandial lipemia in nonalcoholic steatohepatitis. Hepatology 2003;37:909–16.ArticlePubMed
- 10. Shibata M, Kihara Y, Taguchi M, Tashiro M, Otsuki M. Nonalcoholic fatty liver disease is a risk factor for type 2 diabetes in middle-aged Japanese men. Diabetes Care 2007;30:2940–4.ArticlePubMedPDF
- 11. Chen Z, Yu R, Xiong Y, Du F, Zhu S. A vicious circle between insulin resistance and inflammation in nonalcoholic fatty liver disease. Lipids Health Dis 2017;16:203.ArticlePubMedPMCPDF
- 12. Dai W, Ye L, Liu A, Wen SW, Deng J, Wu X, et al. Prevalence of nonalcoholic fatty liver disease in patients with type 2 diabetes mellitus: a meta-analysis. Medicine (Baltimore) 2017;96:e8179.ArticlePubMedPMC
- 13. Younossi ZM, Golabi P, de Avila L, Paik JM, Srishord M, Fukui N, et al. The global epidemiology of NAFLD and NASH in patients with type 2 diabetes: a systematic review and meta-analysis. J Hepatol 2019;71:793–801.ArticlePubMed
- 14. Kang SH, Cho KH, Do JY. Non-alcoholic fatty liver disease is associated with low-grade albuminuria in men without diabetes mellitus. Int J Med Sci 2019;16:285–91.ArticlePubMedPMC
- 15. Lonardo A, Mantovani A, Targher G, Baffy G. Nonalcoholic fatty liver disease and chronic kidney disease: epidemiology, pathogenesis, and clinical and research implications. Int J Mol Sci 2022;23:13320.ArticlePubMedPMC
- 16. Bedogni G, Bellentani S, Miglioli L, Masutti F, Passalacqua M, Castiglione A, et al. The Fatty Liver Index: a simple and accurate predictor of hepatic steatosis in the general population. BMC Gastroenterol 2006;6:33.ArticlePubMedPMCPDF
- 17. Gastaldelli A, Kozakova M, Højlund K, Flyvbjerg A, Favuzzi A, Mitrakou A, et al. Fatty liver is associated with insulin resistance, risk of coronary heart disease, and early atherosclerosis in a large European population. Hepatology 2009;49:1537–44.ArticlePubMed
- 18. Eslam M, Newsome PN, Sarin SK, Anstee QM, Targher G, Romero-Gomez M, et al. A new definition for metabolic dysfunction-associated fatty liver disease: an international expert consensus statement. J Hepatol 2020;73:202–9.ArticlePubMed
- 19. Lee YH, Bang H, Park YM, Bae JC, Lee BW, Kang ES, et al. Non-laboratory-based self-assessment screening score for non-alcoholic fatty liver disease: development, validation and comparison with other scores. PLoS One 2014;9:e107584.ArticlePubMedPMC
- 20. Poynard T, Ratziu V, Naveau S, Thabut D, Charlotte F, Messous D, et al. The diagnostic value of biomarkers (SteatoTest) for the prediction of liver steatosis. Comp Hepatol 2005;4:10.ArticlePubMedPMCPDF
- 21. Kotronen A, Peltonen M, Hakkarainen A, Sevastianova K, Bergholm R, Johansson LM, et al. Prediction of non-alcoholic fatty liver disease and liver fat using metabolic and genetic factors. Gastroenterology 2009;137:865–72.ArticlePubMed
- 22. Lee JH, Kim D, Kim HJ, Lee CH, Yang JI, Kim W, et al. Hepatic steatosis index: a simple screening tool reflecting nonalcoholic fatty liver disease. Dig Liver Dis 2010;42:503–8.ArticlePubMed
- 23. Long MT, Pedley A, Colantonio LD, Massaro JM, Hoffmann U, Muntner P, et al. Development and validation of the Framingham steatosis index to identify persons with hepatic steatosis. Clin Gastroenterol Hepatol 2016;14:1172–80.ArticlePubMedPMC
- 24. Angulo P, Hui JM, Marchesini G, Bugianesi E, George J, Farrell GC, et al. The NAFLD fibrosis score: a noninvasive system that identifies liver fibrosis in patients with NAFLD. Hepatology 2007;45:846–54.ArticlePubMed
- 25. Vallet-Pichard A, Mallet V, Nalpas B, Verkarre V, Nalpas A, Dhalluin-Venier V, et al. FIB-4: an inexpensive and accurate marker of fibrosis in HCV infection. Comparison with liver biopsy and fibrotest. Hepatology 2007;46:32–6.ArticlePubMed
- 26. Koehler EM, Schouten JN, Hansen BE, Hofman A, Stricker BH, Janssen HL. External validation of the fatty liver index for identifying nonalcoholic fatty liver disease in a population-based study. Clin Gastroenterol Hepatol 2013;11:1201–4.ArticlePubMed
- 27. Calori G, Lattuada G, Ragogna F, Garancini MP, Crosignani P, Villa M, et al. Fatty liver index and mortality: the Cremona study in the 15th year of follow-up. Hepatology 2011;54:145–52.ArticlePubMed
- 28. Kim JH, Kwon SY, Lee SW, Lee CH. Validation of fatty liver index and lipid accumulation product for predicting fatty liver in Korean population. Liver Int 2011;31:1600–1.ArticlePubMed
- 29. Huang X, Xu M, Chen Y, Peng K, Huang Y, Wang P, et al. Validation of the fatty liver index for nonalcoholic fatty liver disease in middle-aged and elderly Chinese. Medicine (Baltimore) 2015;94:e1682.ArticlePubMedPMC
- 30. Kim SY, Kim HJ. Trends in alcohol consumption for Korean adults from 1998 to 2018: Korea National Health and Nutritional Examination Survey. Nutrients 2021;13:609.ArticlePubMedPMC
- 31. Fan JG. Epidemiology of alcoholic and nonalcoholic fatty liver disease in China. J Gastroenterol Hepatol 2013;28(Suppl 1):11–7.ArticlePubMedPDF
References
Figure & Data
References
Citations
 PubReader
 ePub Link
 Cite
Cite- Figure
-


- Related articles
-
- Optimal examination for traumatic nerve/muscle injuries in earthquake survivors: a retrospective observational study
- Association between total body muscle percentage and prevalence of non-alcoholic fatty liver disease in Korean adults findings from an 18-year follow-up: a prospective cohort study
- Depression, sleep quality, and body image disturbances among pregnant women in India: a cross-sectional study
- Association between dental amalgam restoration and urine mercury concentrations among young women: a cross-sectional study
- Association of advanced chronic kidney disease with diabetic retinopathy severity in older patients with diabetes: a retrospective cross-sectional study

