E-Submission
PubMed Central, CAS, DOAJ, KCI

Articles
- Page Path
- HOME > J Yeungnam Med Sci > Volume 40(1); 2023 > Article
-
Original article
The impact of quality of life measured by WHOQOL-BREF on mortality in maintenance hemodialysis patients: a single center retrospective cross-sectional study -
Seong Gyu Kim
 , In Hee Lee
 -
Journal of Yeungnam Medical Science 2023;40(1):49-57.
DOI: https://doi.org/10.12701/jyms.2022.00080
Published online: April 18, 2022
Division of Nephrology, Department of Internal Medicine, Daegu Catholic University School of Medicine, Daegu, Korea
- Corresponding author: Seong Gyu Kim, MD Department of Internal Medicine, Daegu Catholic University School of Medicine, 33 Duryugongwon-ro 17-gil, Nam-gu, Daegu 42472, Korea Tel: +82-53-650-4275 • Fax: +82-53-623-7507 • E-mail: ksgnephro@cu.ac.kr
Copyright © 2023 Yeungnam University College of Medicine, Yeungnam University Institute of Medical Science
This is an Open Access article distributed under the terms of the Creative Commons Attribution Non-Commercial License (http://creativecommons.org/licenses/by-nc/4.0/) which permits unrestricted non-commercial use, distribution, and reproduction in any medium, provided the original work is properly cited.
Abstract
-
Background
- Several previous studies have reported that quality of life (QoL) in hemodialysis patients affects mortality. However, the 36-item Short Form Health Survey, which has been used mainly in previous studies, is complicated in terms of questionnaire composition and interpretation. This study aimed to identify the impact of QoL on mortality in hemodialysis patients using an easier and simpler diagnostic tool.
-
Methods
- This retrospective study included 160 hemodialysis patients. QoL was evaluated using the World Health Organization Quality of Life Questionnaire-Brief version (WHOQOL-BREF). Psychosocial factors were evaluated using the Hospital Anxiety and Depression Scale, Multidimensional Scale of Perceived Social Support, Montreal Cognitive Assessment, and Pittsburgh Sleep Quality Index. We also evaluated medical factors, such as dialysis adequacy and laboratory results.
-
Results
- The mean hemodialysis vintage was 70.7±38.0 months. The proportion of patients who were elderly was higher in the mortality group than in the surviving group, and the Charlson Comorbidity Index score was also higher in the former group. Of the four domains of the WHOQOL-BREF, the physical health and psychological scores of the mortality group were significantly lower than those of the survival group. When the score in the physical health domain or psychological domain was ≤10, the 10-year mortality rate after hemodialysis initiation increased by approximately 2.3- and 2-fold, respectively.
-
Conclusion
- QoL may have a significant effect on mortality in patients undergoing hemodialysis. The WHOQOL-BREF is an instrument that can measure QoL relatively easily and can be used to improve the long-term prognosis of patients undergoing hemodialysis.
- Advances in hemodialysis technology have led to a significant reduction in mortality rates and complication risks directly related to hemodialysis since the early 2000s [1]. However, mortality among hemodialysis patients still exceeds 20% annually [2,3]. Robinson et al. [4] analyzed patients from 11 countries who participated in the Dialysis Outcomes and Practice Patterns Study (DOPPS) and reported that the highest mortality occurred in the first 120 days of hemodialysis. Based on data from the End-stage Renal Disease Registry Committee of the Korean Society of Nephrology, 87,993 patients were on hemodialysis, and the 10-year mortality rates on hemodialysis were 38.1% and 62.8%, respectively, in 2017 [5]. Since then, the incidence of hemodialysis has been rapidly increasing by 7% to 10% every year [5].
- Hemodialysis patients are more likely to have psychological problems, limited economic activities, and a reduced quality of life (QoL) due to the impact of end-stage renal disease, comorbidities, and hemodialysis on daily life [6-9]. Numerous studies have reported an association between a lower QoL and mortality in hemodialysis patients [10,11]. Most previous studies have assessed QoL using the 36-item Short Form Health Survey (SF-36) containing 36 questions. However, the SF-36 assesses physical and mental health domains using the same questions and can yield complicated results. Recently, Lee et al. [12] reported that the mortality rate of hemodialysis patients in Korea may increase if the QoL measured using the Kidney Disease Quality of Life Short Form version 1.3 (KDQOL-SF 1.3) is low. However, although the KDQOL-SF 1.3 is a well-validated test tool, it consists of 80 items and has limitations in simplicity and convenience. Furthermore, there have been relatively few reports of QoL-related mortality in hemodialysis patients in Korea, and the sample size is not large.
- Thus, in this study, we used the World Health Organization Quality of Life Questionnaire-Brief version (WHOQOL-BREF), which is relatively simple and easy to interpret, as a diagnostic tool for QoL. Psychosocial and medical factors as well as QoL were investigated and used to analyze the mortality rate in hemodialysis patients. This study aimed to investigate the impact of QoL measured by the WHOQOL-BREF on the mortality rate of hemodialysis patients using these factors.
Introduction
- Ethics statements: This study was approved by the Institutional Review Board (IRB) of Daegu Catholic University Hospital (IRB No: CR-13-076). Informed consent was obtained from all subjects when they were enrolled.
- 1. Study design
- This single center retrospective cross-sectional study analyzed 160 patients undergoing hemodialysis at the Daegu Catholic University Hospital in Daegu, Korea. Data from September 2013 to October 2013 were used, and a questionnaire survey was conducted during the same period. Patients who could understand, speak, and read Korean were included in this study. Patients with vision problems completed the questionnaire with the examiner’s assistance. Patients who received treatment for acute disease completed the questionnaire after recovery. Patients who were on hemodialysis at Daegu Catholic University Hospital for <1 month (n=4), were <20 years or ≥80 years old (n=4), had a history of psychological disorders (n=3), or refused to participate (n=8) were excluded from the study at the time of recruitment. All participants received hemodialysis three times per week for 4 hours per session.
- We investigated hypertension, diabetes mellitus, cardiovascular disease, cerebrovascular accident, cancer, and liver disease as underlying diseases. The investigation of these underlying diseases was conducted based on electronic medical records within 6 months of the same period during which the subjects were included in the study, and tests for QoL and psychosocial indicators were performed. Individuals with hypertension, diabetes, cardiovascular disease, and cerebrovascular accidents were defined as those who had been diagnosed or were already taking therapeutic medications prior to inclusion in this study. Cardiovascular disease included myocardial infarction, other ischemic heart diseases, congestive heart failure with or without preserved systolic function, arrhythmias, and valvular disease. As the underlying disease, cancer was defined as a non-overt disease with a history of diagnosis and treatment prior to participation in this study. Liver disease was defined as chronic hepatitis or cirrhosis. The Charlson Comorbidity Index (CCI) is widely used to assess the risk of comorbidities that affect patient mortality and was determined for each patient in this study [13]. The CCI was calculated based on each patient’s status at baseline.
- The WHOQOL-BREF was used to assess QoL. The WHOQOL-BREF contains 24 questions across four domains (physical health, psychological, social relationships, and environmental domains) and two questions on overall QoL and general health awareness [14]. The total score for each domain ranges from 4 to 20 points. Although there is no official cutoff value, higher scores indicate a higher QoL. In this study, the cutoff value for each domain of the WHOQOL-BREF was set to 10 points, which is half of the maximum. The Korean version of the WHOQOL-BREF with verified validity and reliability was used in this study [15].
- The Hospital Anxiety and Depression Scale (HADS), Multidimensional Scale of Perceived Social Support (MSPSS), Montreal Cognitive Assessment (MoCA), and Pittsburgh Sleep Quality Index (PSQI) were used to assess psychosocial factors. All these instruments are self-reported questionnaires with verified validity and reliability [16-23]. The HADS has 14 questions, with the odd-numbered questions assessing anxiety (HADS-A) and even-numbered questions assessing depression (HADS-D). The score for each question ranges from 0 to 3 points. The cutoff value for the total score for depression and anxiety is 14 points [16,17]. The MSPSS consists of 12 questions evenly spread across three sources of social support: family, friends, and significant others. The questions are rated on a 7-point scale, with higher scores indicating higher levels of social support [18,19]. The MoCA consists of five questions on visuospatial and executive functioning, three on naming, five on memory (immediate recall and delayed recall), eight on attention, three on language, two on abstraction, and six on orientation. The total score is out of 32. Scores are adjusted for differences in cognitive abilities between patients with different educational levels by providing an extra point to those who had ≤6 years of education. A cutoff score of ≤22 points is used to identify mild cognitive impairment, with lower scores indicating more severe cognitive impairment [20,21]. The PSQI contains 19 questions across seven domains. Higher scores indicate more severe sleep disorders, and a cutoff score of 5 is used to identify sleep disorders [22,23].
- Blood pressure and body mass index were measured, and the causes of end-stage renal disease, comorbidities, and period of hemodialysis were investigated by reviewing electronic medical records. To measure hemodialysis adequacy, urea clearance×time/volume (Kt/V) was measured. Kt/V was calculated using the Daugirdas formula [24]. The normalized protein catabolic rate (nPCR) was used as a nutritional status marker. nPCR was calculated based on a two-point modeling of hemodialysis urea kinetics, as suggested by Depner and Daugirdas [25]. A blood test was used to measure the complete blood count and levels of triglycerides, protein, albumin, calcium, phosphorus, and intact parathyroid hormone. Predialysis midweek sampling (Wednesdays and Thursdays) was used to obtain blood from patients undergoing hemodialysis.
- 2. Statistical analysis
- Until October 2021, we investigated patient deaths using electronic medical records. When a patient’s death was confirmed, the patient was allocated to the mortality group. We censored the patient information based on the date of the last outpatient visit if the patient’s death was not confirmed in the electronic medical records of Daegu Catholic University Hospital until October 2021. If a patient received a kidney transplant, we censored the patient’s information based on the date of the kidney transplantation. Hemodialysis vintage was defined as the date from hemodialysis initiation to the date when the data were censored. Continuous variables with normal distributions are expressed as mean±standard deviation and were analyzed using an independent two-sample t-test. Continuous variables with non-normal distributions are expressed as medians and interquartile ranges. Continuous variables with non-normal distributions were analyzed using the Mann-Whitney U-test. Categorical variables are expressed as counts and percentages. Categorical variables were analyzed using the chi-square or Fisher exact test. Cox proportional regression analysis was used together with the forward conditional method to compare mortality rates according to the groups classified by the cutoff value of each domain of the WHOQOL-BREF. Male sex, age of ≥60 years, CCI scores of ≥4 points, moderate-to-severe cognitive impairment by MoCA, and serum calcium concentrations of <8.7 mg/dL were considered as confounding variables for multivariate analysis of QoL-related mortality. The level of statistical significance was set at p<0.05. All statistical analyses were performed using IBM SPSS ver. 19.0 (IBM Corp., Armonk, NY, USA).
Methods
- 1. Baseline characteristics
- A comparison of the basic characteristics of the survival and mortality groups is summarized in Table 1. Of the 160 patients, 41 were in the mortality group and 119 were in the survival group. The mean hemodialysis vintage was 72.0 and 66.9 months for the respective groups, with no significant difference (p=0.465). The mean age and proportion of patients aged ≥60 years were significantly higher in the mortality group than in the survival group (mean age, p<0.001; proportion ≥60 years, mortality group [73.2%] vs. survival group [41.2%], p<0.001). Significantly higher rates of underlying cardiovascular disease and cancer were found in the mortality group compared to that in the survival group (cardiovascular disease, p=0.024; cancer, p=0.004). A significant difference was found in the mean CCI score between the mortality and survival groups (p=0.006). However, no significant difference in the proportion of patients with CCI scores of ≥4, which indicates severe comorbidities, was found between the two groups (p=0.114).
- Among the medical factors, the mean diastolic blood pressure after hemodialysis was lower in the mortality group than in the survival group (p=0.006). The mean serum calcium concentration was lower in the mortality group than in the survival group (p=0.014). The proportion of patients with serum calcium concentrations of <8.7 mg/dL was 67.5% and 48.7% in the mortality and survival groups, respectively; thus, more patients had hypocalcemia in the mortality group than in the survival group (p=0.040).
- 2. Comparisons of indicators between survival and mortality groups
- A comparison of the indicators between the survival and mortality groups is summarized in Table 2. Among the four domains of the WHOQOL-BREF, the mean scores in the physical health, psychological, and environmental domains were significantly lower in the mortality group than in the survival group (physical health domain, p=0.009; psychological domain, p=0.013; environmental domain, p=0.038). We compared the proportions using a cutoff value of 10 points, which is half of the total score of 20 points for each domain of the WHOQOL-BREF. The results showed that the proportion of scores ≤10 in the physical health and psychological domains was higher in the mortality group than in the survival group (physical health domain, 74.3% vs. 52.2%, p=0.021; psychological domain, 45.7% vs. 26.5%, p=0.032). However, the proportion of environmental domain scores ≤10 did not differ significantly between the mortality (42.5%) and survival (57.1%) groups (p=0.128).
- No significant differences in the mean scores of the total HADS, HADS-A, and HADS-D were found between the two groups. No significant differences in the total MSPSS score and scores for family, friends, and significant others were found between the two groups. The mean MoCA score showed that cognitive ability decreased significantly more in the mortality group than in the survival group (p=0.045). However, no significant difference was found in the proportion of patients with moderate-to-severe cognitive impairment between the mortality group (61.0%) and the survival group (51.3%) (p=0.084). No significant differences were found in the mean PSQI scores between the two groups.
- 3. Association between quality of life scales and mortality
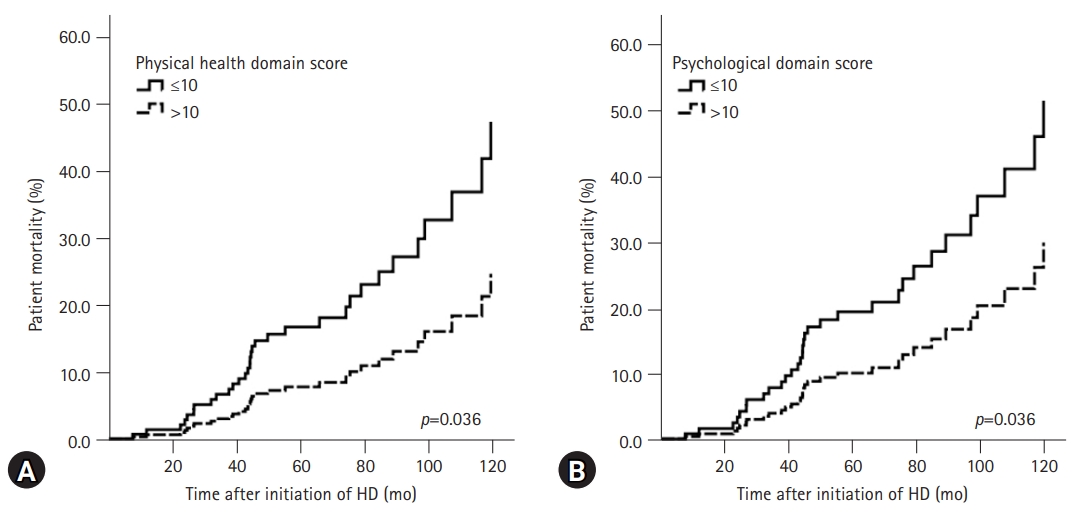
- The results of the Cox regression analysis of the QoL-related 10-year mortality rate after hemodialysis initiation are summarized in Table 3. In the univariate analysis, among the domains of the WHOQOL-BREF, only the physical health and psychological domains were significantly associated with a score of ≤10 in each domain and 10-year mortality after hemodialysis initiation. In the univariate analysis, if the score in the physical health or psychological domains was ≤10, the 10-year mortality rate after hemodialysis was increased by approximately 2.0 and 2.3 times, respectively, and it was statistically significant (physical health domain, p=0.038; psychological domain, p=0.020). In addition, in the multivariate analysis adjusted for variables such as male sex, age of ≥60 years, CCI of ≥4, moderate-to-severe cognitive impairment by MoCA, and serum calcium concentrations of <8.7 mg/dL, when the score in the physical health or psychological domains was ≤10, the 10-year mortality rate after initiation of hemodialysis was significantly increased by approximately 2.3 and 2.0 times, respectively (physical health domain, p=0.036; psychological domain, p=0.036). Among the adjusted factors in the multivariate analysis, the significant risk factors for 10-year mortality after hemodialysis initiation were age of ≥60 years and hypocalcemia in both the physical and psychological domains. Even when these two factors were analyzed univariately, the mortality rate at 10 years after starting dialysis significantly increased. The 10-year cumulative death curves of the physical health and psychological domains of the WHOQOL-BREF as determined through the multivariate regression analysis are presented in Fig. 1.
Results
- Several previous studies have reported an association between reduced QoL and increased mortality in patients receiving hemodialysis [10-12,26-28]. Most studies have assessed QoL using the SF-36. The SF-36 consists of 36 items and assesses two domains; physical health and mental health [29]. However, in the SF-36, five questions corresponding to general health and four questions corresponding to vitality out of the 36 questions are duplicated in these two domains. Therefore, there might be some limitations in the interpretation of the SF-36 results. To overcome this SF-36 limitation, we assessed QoL in this study using the WHOQOL-BREF, which has four independent domains as well as questions and results that are relatively easy to understand. The WHOQOL-BREF is an abbreviated version of the 100-question WHOQOL-100. The latter also consists of four domains, and it was confirmed that the score of each domain of the WHOQOL-BREF was highly correlated with the score of each domain of the WHOQOL-100 [14]. The WHOQOL-BREF demonstrated cross-cultural validity and reproducibility in a study of 11,830 adults in 23 countries [30].
- In the present study, the mortality group scored lower in the physical and psychological domains of the WHOQOL-BREF than the survival group did. The multivariate Cox proportional regression analysis showed a 2.3- and 2-fold increase in 10-year mortality after initiation of hemodialysis in maintenance hemodialysis patients whose scores in the physical health domain or psychological domain were ≤10 points, respectively. In previous studies using DOPPS cohort data, Mapes et al. [11] reported that the hazard ratio increased 1.25- and 1.13-fold for every 10-point decrease in the scores for the physical and psychological domains of the SF-36, and Perl et al. [10] reported that the hazard ratio for death increased 1.09- and 1.05-fold for every 5-point decrease in the scores for the respective domains of the SF-36. Liebman et al. [28] measured SF-36 scores twice at 6-month intervals and reported that the mortality rate 1 year after the second test increased 1.33-fold when the score for the psychological domain decreased by at least five points. Unlike the two previous studies, although Liebman et al. [28] did not show a significant difference in the mortality rate in the physical health domain, lower scores in the physical health domain tended to have a higher mortality rate. In addition, Liebman et al. [28] showed that the mean score in the physical health domain decreased in the follow-up surveys at 6-month intervals. This suggests that lower scores in the physical health and psychological domains are important for the patient mortality rate in the QoL measured by the SF-36. Although our study used different diagnostic tools, lower physical health and psychological domains showed increased patient mortality, which may be consistent with these other studies. However, one difference is that our study assessed the long-term mortality rate that affects QoL, whereas the other studies analyzed a short-term mortality rate of 6 months to 1 year.
- Studies on the impact of QoL measured using the WHOQOL-BREF on the mortality rate in hemodialysis patients are few, but relatively small-scale studies have been reported in Taiwan [31]. Wang et al. [31] reported that the lowest QoL tertile measured by the WHOQOL-BREF for 151 hemodialysis patients had a significantly higher 3-year mortality rate. In this study by Wang et al. [31], the mean score of all four domains of the WHOQOL-BREF was significantly lower in the mortality group. Among the four domains of the WHOQOL-BREF, those where the lowest tertile had a significantly higher 3-year mortality rate were the physical health, social, and environmental domains [31]. In particular, the finding that the physical health domain had the greatest effect on mortality in hemodialysis patients was consistent with our results; however, the other domains that affected mortality in hemodialysis patients were different. These differences might be due to the possibility that social or environmental domains could be affected by national, regional, and economic conditions. Moreover, in our study, there was no significant difference between the mortality and survival groups in the social support level measured by MSPSS or the average score of the social domain of the WHOQOL-BREF, which could be different from the results of Wang et al. [31]. Interestingly, in that study by Wang et al. [31], although depression and poor sleep quality were associated with an increase in the mortality rate of hemodialysis patients, the psychological domain of the WHOQOL-BREF did not show a statistically significant relationship with the mortality rate of hemodialysis patients. In contrast, in the present study, a low psychological domain score of the WHOQOL-BREF increased the mortality rate of hemodialysis patients, but there was no difference in depression or sleep quality, as assessed by the HADS or PSQI, between the mortality and survival groups. However, it should be considered that the cutoff values for each domain in the WHOQOL-BREF were different in each study and that both studies had small sample sizes. Therefore, large-scale, well-designed studies and a consensus on the appropriate cutoff values for the application of WHOQOL-BREF to hemodialysis patients are needed in the future.
- Recently, a nationwide multicenter study was conducted on the effect of QoL in hemodialysis patients in Korea using the Clinical Research Center for End-Stage Renal Disease (CRC for ESRD) cohort [12]. Lee et al. [12] reported that among the final 568 hemodialysis patients, a lower score in the physical health domain was associated with an increase in the mortality rate among the QoL measures of the KDQOL-SF 1.3, but the psychological domain was not related to the mortality rate. Lee et al. [12] also hypothesized that the reason for the different QoL domains related to mortality in previous studies was a difference in the basic characteristics of the study populations. Although it is not possible to compare the differences in basic characteristics directly between the studies, when compared with that of Lee et al. [12], our study population had a higher rate of cardiovascular disease, while the mean CCI tended to be lower. However, as mentioned in the Introduction, the KDQOL-SF 1.3 consists of 100 questions; thus, it may be difficult to use this questionnaire repeatedly for hemodialysis patients.
- This study had several limitations. First, there may have been selection bias. In Korea, after hemodialysis is initiated at a tertiary general hospital, only some patients continue on outpatient maintenance dialysis at tertiary general hospitals; most are transferred to other hemodialysis centers. Because this process is not carried out consistently for medical judgment or research purposes, differences in basic characteristics may occur between the transferred and non-transferred groups or between tertiary hospitals. Second, this study comprised a small sample size and involved a single institution. Third, this cross-sectional study did not account for changes in various indicators that occur over time. Despite these limitations, this study had several strengths. First, it elucidated the impact of QoL on mortality in patients undergoing hemodialysis. Second, the WHOQOL-BREF, used to assess QoL in this study, has been translated into various languages and is widely used worldwide. It is a simple questionnaire with four clearly defined domains that patients can complete while undergoing hemodialysis, and its results are easy to interpret. Third, this study collected a relatively wide range of laboratory data, including data on various factors affecting mortality in hemodialysis patients, and used various instruments to assess the QoL and psychological health of hemodialysis patients.
- In summary, QoL can significantly affect mortality in patients undergoing maintenance hemodialysis. It may be useful not only to obtain laboratory data such as age, comorbidities, and blood calcium concentrations, but also to assess QoL and the long-term prognosis of patients on maintenance hemodialysis. The WHOQOL-BREF is a tool that allows for a relatively simple QoL assessment and may be considered when trying to predict the long-term outcome of patients on maintenance hemodialysis.
Discussion
-
Conflicts of interest
No potential conflict of interest relevant to this article was reported.
-
Funding
None.
-
Author contributions
Conceptualization, Formal analysis, Methodology, Investigation: SGK, IHL; Data curation, Project administration, Visualization, Software, Validation: SGK; Supervision: IH Lee; Writing-original draft: SGK; Writing-review & editing: SGK, IHL.
Notes

Values are presented as number only, mean±standard deviation, or number (%).
ESRD, end-stage renal disease; CGN, chronic glomerulonephritis; CVD, cardiovascular disease; CVA, cerebrovascular accident; CCI, Charlson Comorbidity Index; HD, hemodialysis; BP, blood pressure; SBP, systolic blood pressure; DBP, diastolic blood pressure; Kt/V, urea clearance × time/volume; nPCR, normalized protein catabolic rate; HDL, high-density lipoprotein; LDL, low-density lipoprotein; Na, sodium; K, potassium; Cl, chloride; tCO2, total carbon dioxide; iPTH, intact parathyroid hormone; HbA1c, glycated hemoglobin.
Values are presented as mean±standard deviation.
WHOQOL-BREF, World Health Organization Quality of Life Questionnaire-Brief version; HADS, Hospital Anxiety and Depression Scale; HADS-A, HADS-Anxiety; HADS-D, HADS-Depression; MSPSS, Multidimensional Scale of Perceived Social Support; MoCA, Montreal Cognitive Assessment; PSQI, Pittsburgh Sleep Quality Index.
| Variable |
Univariate regression model |
Multivariate regression model 1a) |
Multivariate regression model 2b) |
|||
|---|---|---|---|---|---|---|
| HR (95% CI) | p-value | HR (95% CI) | p-value | HR (95% CI) | p-value | |
| WHOQOL-BREF | ||||||
| Physical health domain score, ≤10 | 1.95 (1.02–3.91) | 0.038 | 2.27 (1.02–5.05) | 0.036 | 2.04 (1.02–4.09) | 0.036 |
| Psychological domain score, ≤10 | 2.28 (1.14–4.57) | 0.020 | ||||
| Social relationship domain score, ≤10 | 1.49 (0.74–2.98) | 0.262 | ||||
| Environmental domain score, ≤10 | 1.34 (0.66–2.69) | 0.418 | ||||
| Elderly, ≥60 yr | 3.15 (1.48–6.69) | 0.003 | 2.78 (1.28–6.02) | 0.010 | 2.75 (1.27–5.96) | 0.010 |
| Male sex | 0.99 (0.51–1.91) | 0.980 | 0.64 (0.31–1.34) | 0.236 | 0.68 (0.33–1.41) | 0.299 |
| CCI, ≥4 | 1.52 (0.72–3.24) | 0.276 | 1.40 (0.58–3.35) | 0.457 | 1.62 (0.66–3.95) | 0.289 |
| Calcium, <8.7 mg/dL | 2.60 (1.31–5.16) | 0.006 | 3.03 (1.42–6.46) | 0.004 | 2.93 (1.37–6.24) | 0.005 |
| Moderate-to-severe cognitive impairment | 1.67 (0.79–3.54) | 0.276 | 1.21 (0.54–2.72) | 0.650 | 1.18 (0.52–2.65) | 0.694 |
HR, hazard ratio; CI, confidence interval; WHOQOL-BREF, World Health Organization Quality of Life Questionnaire-Brief version; CCI, Charlson Comorbidity Index.
a) The result of multiple regression analysis of the patient mortality rate for the physical health domain score of the WHOQOL-BREF. These results were adjusted by male sex, age of ≥60 years, CCI scores of ≥4 points, moderate-to-severe cognitive impairment by Montreal Cognitive Assessment, and serum calcium of <8.7 mg/dL.
b) The result of multiple regression analysis of the patient mortality rate for the psychological domain score of the WHOQOL-BREF. These results were adjusted by male sex, age of ≥60 years, CCI scores ≥4 points, moderate-to-severe cognitive impairment by Montreal Cognitive Assessment, and serum calcium of <8.7 mg/dL.
- 1. Himmelfarb J, Kliger AS. End-stage renal disease measures of quality. Annu Rev Med 2007;58:387–99.ArticlePubMed
- 2. Bradbury BD, Fissell RB, Albert JM, Anthony MS, Critchlow CW, Pisoni RL, et al. Predictors of early mortality among incident US hemodialysis patients in the Dialysis Outcomes and Practice Patterns Study (DOPPS). Clin J Am Soc Nephrol 2007;2:89–99.ArticlePubMed
- 3. Collins AJ, Foley RN, Chavers B, Gilbertson D, Herzog C, Johansen K, et al. United States Renal Data System 2011 Annual Data Report: atlas of chronic kidney disease & end-stage renal disease in the United States. Am J Kidney Dis 2012;59(1 Suppl 1):A7.ArticlePubMed
- 4. Robinson BM, Zhang J, Morgenstern H, Bradbury BD, Ng LJ, McCullough KP, et al. Worldwide, mortality risk is high soon after initiation of hemodialysis. Kidney Int 2014;85:158–65.ArticlePubMed
- 5. Jin DC. Analysis of mortality risk from Korean hemodialysis registry data 2017. Kidney Res Clin Pract 2019;38:169–75.ArticlePubMedPMC
- 6. Kimmel PL, Peterson RA. Depression in end-stage renal disease patients treated with hemodialysis: tools, correlates, outcomes, and needs. Semin Dial 2005;18:91–7.ArticlePubMed
- 7. Perl J, Unruh ML, Chan CT. Sleep disorders in end-stage renal disease: ‘markers of inadequate dialysis’? Kidney Int 2006;70:1687–93.ArticlePubMed
- 8. Mehrotra R, Kopple JD. Nutritional management of maintenance dialysis patients: why aren’t we doing better? Annu Rev Nutr 2001;21:343–79.ArticlePubMed
- 9. Toorians AW, Janssen E, Laan E, Gooren LJ, Giltay EJ, Oe PL, et al. Chronic renal failure and sexual functioning: clinical status versus objectively assessed sexual response. Nephrol Dial Transplant 1997;12:2654–63.ArticlePubMed
- 10. Perl J, Karaboyas A, Morgenstern H, Sen A, Rayner HC, Vanholder RC, et al. Association between changes in quality of life and mortality in hemodialysis patients: results from the DOPPS. Nephrol Dial Transplant 2017;32:521–7.ArticlePubMed
- 11. Mapes DL, Lopes AA, Satayathum S, McCullough KP, Goodkin DA, Locatelli F, et al. Health-related quality of life as a predictor of mortality and hospitalization: the Dialysis Outcomes and Practice Patterns Study (DOPPS). Kidney Int 2003;64:339–49.ArticlePubMed
- 12. Lee J, Kim YC, Kwon S, Li L, Oh S, Kim DH, et al. Impact of health-related quality of life on survival after dialysis initiation: a prospective cohort study in Korea. Kidney Res Clin Pract 2020;39:426–40.ArticlePubMedPMC
- 13. Charlson ME, Pompei P, Ales KL, MacKenzie CR. A new method of classifying prognostic comorbidity in longitudinal studies: development and validation. J Chronic Dis 1987;40:373–83.ArticlePubMed
- 14. The WHOQOL Group. Development of the World Health Organization WHOQOL-BREF quality of life assessment. Psychol Med 1998;28:551–8.ArticlePubMed
- 15. Min SK, Kim KI, Lee CI, Jung YC, Suh SY, Kim DK. Development of the Korean versions of WHO Quality of Life scale and WHOQOL-BREF. Qual Life Res 2002;11:593–600.ArticlePubMed
- 16. Zigmond AS, Snaith RP. The hospital anxiety and depression scale. Acta Psychiatr Scand 1983;67:361–70.ArticlePubMed
- 17. Oh SM, Min KJ, Park DB. A study on the standardization of the Hospital Anxiety and Depression Scale for Koreans: a comparison of normal, depressed and anxious groups. J Korean Neuropsychiatr Assoc 1999;38:289–96.
- 18. Zimet GD, Powell SS, Farley GK, Werkman S, Berkoff KA. Psychometric characteristics of the Multidimensional Scale of Perceived Social Support. J Pers Assess 1990;55:610–7.ArticlePubMed
- 19. Dahlem NW, Zimet GD, Walker RR. The Multidimensional Scale of Perceived Social Support: a confirmation study. J Clin Psychol 1991;47:756–61.ArticlePubMed
- 20. Nasreddine ZS, Phillips NA, Bédirian V, Charbonneau S, Whitehead V, Collin I, et al. The Montreal Cognitive Assessment, MoCA: a brief screening tool for mild cognitive impairment. J Am Geriatr Soc 2005;53:695–9.ArticlePubMed
- 21. Kang JM, Cho YS, Park S, Lee BH, Sohn BK, Choi CH, et al. Montreal cognitive assessment reflects cognitive reserve. BMC Geriatr 2018;18:261.ArticlePubMedPMC
- 22. Buysse DJ, Reynolds CF 3rd, Monk TH, Berman SR, Kupfer DJ. The Pittsburgh Sleep Quality Index: a new instrument for psychiatric practice and research. Psychiatry Res 1989;28:193–213.ArticlePubMed
- 23. Mollayeva T, Thurairajah P, Burton K, Mollayeva S, Shapiro CM, Colantonio A. The Pittsburgh sleep quality index as a screening tool for sleep dysfunction in clinical and non-clinical samples: a systematic review and meta-analysis. Sleep Med Rev 2016;25:52–73.ArticlePubMed
- 24. Daugirdas JT. Second generation logarithmic estimates of single-pool variable volume Kt/V: an analysis of error. J Am Soc Nephrol 1993;4:1205–13.ArticlePubMed
- 25. Depner TA, Daugirdas JT. Equations for normalized protein catabolic rate based on two-point modeling of hemodialysis urea kinetics. J Am Soc Nephrol 1996;7:780–5.ArticlePubMed
- 26. Feroze U, Noori N, Kovesdy CP, Molnar MZ, Martin DJ, Reina-Patton A, et al. Quality-of-life and mortality in hemodialysis patients: roles of race and nutritional status. Clin J Am Soc Nephrol 2011;6:1100–11.ArticlePubMedPMC
- 27. Kalantar-Zadeh K, Kopple JD, Block G, Humphreys MH. Association among SF36 quality of life measures and nutrition, hospitalization, and mortality in hemodialysis. J Am Soc Nephrol 2001;12:2797–806.ArticlePubMed
- 28. Liebman S, Li NC, Lacson E. Change in quality of life and one-year mortality risk in maintenance dialysis patients. Qual Life Res 2016;25:2295–306.ArticlePubMed
- 29. Brazier JE, Harper R, Jones NM, O’Cathain A, Thomas KJ, Usherwood T, et al. Validating the SF-36 health survey questionnaire: new outcome measure for primary care. BMJ 1992;305:160–4.ArticlePubMedPMC
- 30. Skevington SM, Lotfy M, O’Connell KA; WHOQOL Group. The World Health Organization’s WHOQOL-BREF quality of life assessment: psychometric properties and results of the international field trial. A report from the WHOQOL group. Qual Life Res 2004;13:299–310.ArticlePubMed
- 31. Wang HH, Ho MC, Hung KY, Cheng HT. A single question regarding mobility in the World Health Organization quality of life questionnaire predicts 3-year mortality in patients receiving chronic hemodialysis. Sci Rep 2017;7:11981.ArticlePubMedPMC
References
Figure & Data
References
Citations
- Application of standardized management and effect evaluation of chronic obstructive pulmonary disease patients using the big data center of the Internet of Things
Xiaoping Chen, Fei He, Yan Jiang, Xuezhen Chen, Yubing Yan
DIGITAL HEALTH.2024;[Epub] CrossRef
 PubReader
 ePub Link
 Cite
Cite