The effect and therapeutic compliance of adjuvant therapy in patients with cholangiocarcinoma after R0 resection: a retrospective study
Article information

Abstract
Background
This study aimed to compare clinical outcomes between surveillance and adjuvant therapy (AT) groups after R0 resection for cholangiocarcinoma (CCA).
Methods
A total of 154 patients who underwent R0 resection for CCA at the Daegu Catholic University Medical Center between January 2010 and December 2019 were included. Overall survival (OS) and progression-free survival (PFS) were analyzed.
Results
The median follow-up duration was 899 days. There were 109 patients in the AT group and 45 patients in the surveillance group. The patients in the AT group were younger (67 years vs. 74 years, p<0.001) and included more males (64.2% vs. 46.7%, p=0.044). The proportion of patients with stage III CCA was larger in the AT group than in the surveillance group (13.8% vs. 2.2%, p=0.005). In addition, AT did not improve OS (5-year OS rate, 69.3% in the AT group vs. 64.2% in the surveillance group, p=0.806) or PFS (5-year PFS rate, 42.6% in the AT group vs. 48.9% in the surveillance group, p=0.113). In multivariate analysis using the Cox proportional hazards model, stage III CCA (hazard ratio [HR], 10.81; 95% confidence interval [CI], 2.92–40.00; p<0.001) was a significant predictor of OS. American Society of Anesthesiologists classification II (HR, 0.50; 95% CI, 0.31–0.81; p=0.005), and American Joint Committee on Cancer stages II (HR, 3.14; 95% CI, 1.25–7.89; p=0.015) and III (HR, 8.08; 95% CI, 2.80–23.32; p<0.001) were independent predictors of PFS.
Conclusion
AT after R0 resection for CCA did not improve OS or PFS.
Introduction
Cholangiocarcinoma (CCA) is an epithelial cell malignancy that occurs anywhere in the biliary system [1]. It is classified according to the anatomical site of origin as intrahepatic, perihilar, or distal CCA [1,2]. The incidence of CCA varies globally, ranging from 2.3 to14.5 per 100,000 people in the East and 0.3 to 3.4 per 100,000 people in the West [2]. Despite advances in treatment, the 5-year overall survival rate (OSR) remains poor, ranging from 10% to 40% [3,4]. In Korea from 2006 to 2015, the incidence of CCA decreased but was still high at 7.8 per 100,000 people for intrahepatic CCA and 6.7 per 100,000 people for extrahepatic CCA [5]. The 5-year OSRs of extrahepatic and intrahepatic CCA in Korea were 27.8% and 15.9%, respectively [5].
Although surgical resection is the only curative treatment, most patients are diagnosed with advanced disease, and only 20% to 30% of cases are resectable at diagnosis [3,4]. Moreover, more than two-thirds of patients relapse within 5 years after surgery [3]. Therefore, various studies on adjuvant therapy (AT) for CCA have investigated many chemotherapeutic agents, radiotherapy, or both, which had previously been demonstrated to be effective for locally advanced and metastatic CCA [3]. However, the few large prospective studies on AT conducted to date have produced disappointing results [6-10]. The effect of AT on CCA has been inconsistent among several recent retrospective studies [11-20]. In particular, if patients have undergone R0 resection, the National Comprehensive Cancer Network guidelines recommend all possible options: observation, systemic therapy, or clinical trial [21].
Therefore, this study aimed to retrospectively investigate the effect of AT on CCA after R0 resection. We also analyzed prognostic factors associated with overall survival (OS) and progression-free survival (PFS). Furthermore, the therapeutic compliance of AT was evaluated.
Methods
Ethical statements: This study was performed in compliance with the ethical guidelines of the revised Helsinki Declaration of 2013. This study was reviewed and approved by the Institutional Review Board (IRB) of the Daegu Catholic University Medical Center (IRB No: CR-21-107-L). Since this study was retrospective, the need for informed consent was waived.
1. Study population
A total of 210 patients who underwent curative surgery for CCA at Daegu Catholic University Medical Center between January 2010 and December 2019 were eligible for this study (Fig. 1). Cases were collected using diagnostic codes (C221, C240, C248, and C249) based on the 8th revision of the Korean Standard Classification of Diseases. The following were exclusion criteria: (1) positive resection margins, (2) death due to surgical complications, (3) follow-up at another hospital after surgery, (4) distant metastasis at the time of surgery, and (5) neuroendocrine tumors.
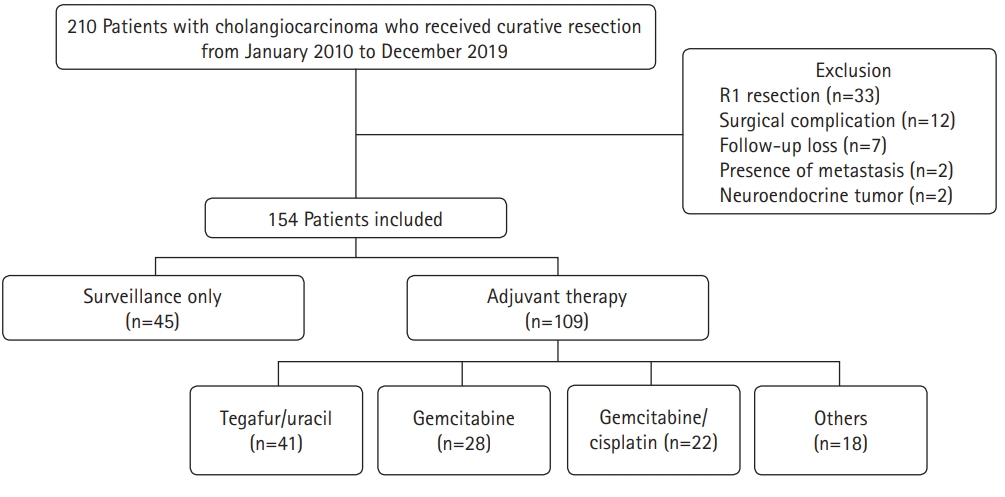
Flowchart of the study population.
2. Study design
This was a retrospective single-center study. The following data were collected from medical records: demographics, preoperative serum carbohydrate antigen 19-9 (CA 19-9) and carcinoembryonic antigen (CEA) levels, tumor location, AT regimen, radiologic findings, and pathologic findings such as perineural invasion, differentiation, lymphovascular invasion, and extent of resection. Survival data were also obtained from the medical records. Disease stage was reclassified based on the American Joint Committee on Cancer (AJCC) Cancer Staging Manual (8th edition). Patients were then divided into surveillance and AT groups to investigate the effects of AT. We also investigated the therapeutic adherence to AT.
3. Definitions
Patients who received planned chemotherapy or chemoradiotherapy after R0 resection were assigned to the AT group. Patients who continued follow-up without adjuvant chemotherapy or chemoradiotherapy after surgery were assigned to the surveillance group. OS was defined as the time from the date of surgery to the date of death from any cause. PFS was defined as the time from the date of surgery to the date of recurrence. The American Society of Anesthesiologists (ASA) classification was used to evaluate patient performance status. The cut-off level for serum CA 19-9 was 37 U/mL, and that for serum CEA was 5.2 ng/mL.
4. Treatment strategy and follow-up
The AT regimen for each patient was decided at the discretion of the clinician. In the AT group, an abdominal computed tomography (CT) scan was performed every 2 or 3 months during the AT and every 6 or 12 months thereafter. In the surveillance group, a CT scan was performed every 6 or 12 months. In both groups, a CT scan was also performed regardless of the follow-up schedule if the clinician determined that it was necessary because of symptoms or signs such as abdominal pain, fever, and jaundice. Follow-up continued until December 31, 2021, or until death.
5. Statistical analysis
Statistical analysis was performed using IBM SPSS ver. 19.0 for Windows (IBM Corp., Armonk, NY, USA). The chi-square or Fisher exact tests were used to compare categorical variables. Since the continuous variables were not normally distributed, they were described as medians with interquartile ranges, and the Mann-Whitney U-test was used to compare them. OS and PFS were analyzed using Kaplan-Meier survival analysis. The OS and PFS of the AT group and surveillance group were compared with the log-rank test. Subgroup analysis of the following variables was performed: lymphovascular invasion, perineural invasion, AJCC stage, and AT regimens. Univariate analysis was used to identify the prognostic factors associated with OS and PFS in patients with R0-resected CCA. Multivariate analysis was performed using the Cox proportional hazards model with backward elimination for the factors that were significant in the univariate analysis or those considered clinically meaningful in previous studies. The results are presented as hazard ratios (HRs) and 95% confidence intervals (CIs). Statistical significance was defined as a p-value of <0.05 (two-tailed).
Results
1. Baseline characteristics of patients
A total of 154 patients with CCA who underwent R0 resection during the study period were investigated. Of these, 109 patients (70.8%) received AT (AT group) and 45 patients (29.2%) were only followed up (surveillance group). The baseline patient characteristics are shown in Table 1. The patients in the AT group were younger than those in the surveillance group (67 years vs. 74 years, p<0.001). There was also a higher proportion of males and patients with AJCC stage III disease in the AT group than in the surveillance group (64.2% vs. 46.7%, p=0.044 and 13.8% vs. 2.2%, p=0.005, respectively). However, other characteristics, including ASA classification, tumor marker levels, tumor location, and pathologic findings, were not significantly different between the two groups. There were 29 intrahepatic CCA (18.8%), 43 perihilar CCA (27.9%), and 82 distal CCA cases (53.2%). Most cases were adenocarcinomas (96.8%). The most common histologic differentiation was moderately differentiated cancer (56.5%), followed by poorly differentiated (25.3%) and well-differentiated (14.3%) cancer. Lymphovascular invasion and perineural invasion were observed in 53 (34.4%) and 91 patients (48.9%), respectively. The most common AJCC stage was stage II (73.4%), followed by stage I (16.2%) and stage III (10.4%). With regard to the AT regimen, tegafur/uracil (37.6%) was the most commonly used, followed by gemcitabine (25.7%) and gemcitabine/cisplatin (20.2%). Twelve patients in the AT group (11.0%) received chemoradiotherapy.

Baseline characteristics of patients with R0-resected cholangiocarcinoma
2. Survival analysis
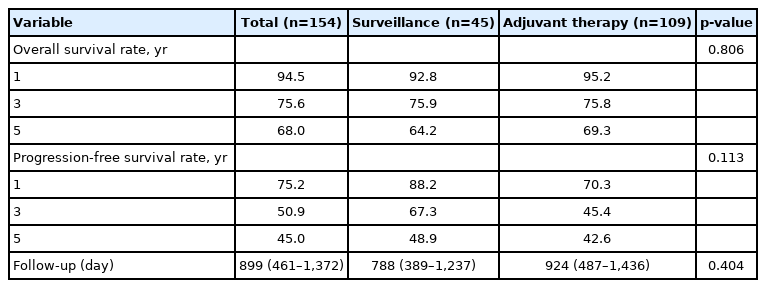
The survival analysis of the patients is shown in Table 2. The median follow-up duration was 899 days. There was no statistically significant difference between the two groups (924 days in the AT group vs. 788 days in the surveillance group, p=0.404). The 1-year, 3-year, and 5-year OSRs for all patients were 94.5%, 75.6%, and 68.0%, respectively. There were no significant differences between the two groups (95.2%, 75.8%, and 69.3% in the AT group vs. 92.8%, 75.9%, and 64.2% in the surveillance group, respectively, p=0.806). In contrast, the PFS rate (PFSR) was higher in the surveillance group, although the difference was not statistically significant (p=0.113). The 1-year, 3-year, and 5-year PFSRs for the surveillance group were 88.2%, 67.3%, and 48.9%, respectively, and those for the AT group were 70.3%, 45.4%, and 42.6%, respectively.
Clinical outcomes of patients with R0-resected cholangiocarcinoma
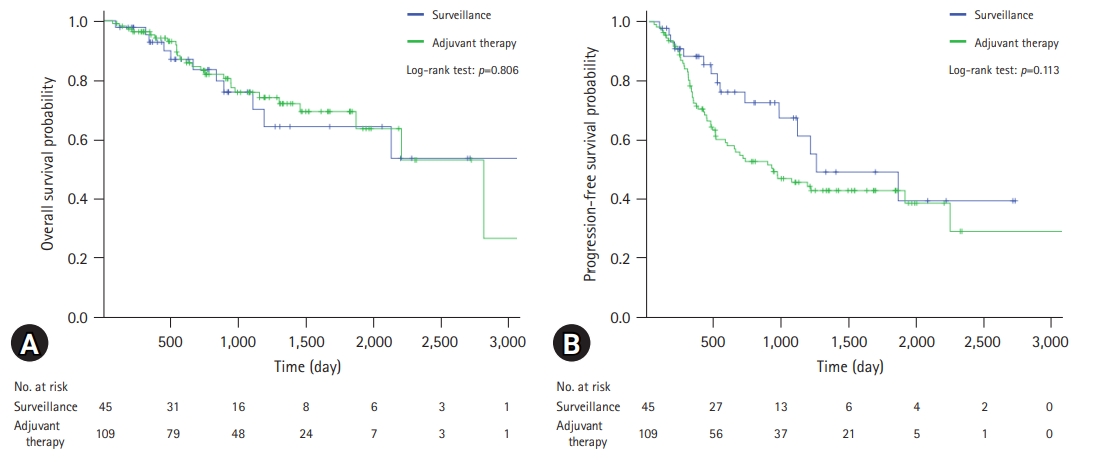
A comparison of the OS and PFS for all patients is shown in Fig. 2. The comparisons of OS and PFS in the subgroups including lymphovascular invasion, perineural invasion, and AJCC stage are shown in Figs. 3, 4, respectively. AT did not demonstrate a survival benefit in any of the analyses. The comparison of OS according to AT regimens is shown in Fig. 5. The 1-year, 3-year, and 5-year OSRs were 100%, 79.3%, and 69.3% in the gemcitabine group; 90.7%, 67.0%, and 55.8% in the gemcitabine/cisplatin group; and 100%, 86.3%, and 81.5% in the tegafur/uracil group, respectively. The tegafur/uracil group showed the highest OSR among the regimens, although the difference was not statistically significant (p=0.358). However, tegafur/uracil did not demonstrate a survival benefit compared with the surveillance group (p=0.268). A comparison of PFS according to the AT regimens is shown in Fig. 6. Similar to the OSR analysis, the tegafur/uracil group showed the highest PFSR among the regimens, although it was not statistically significant (p=0.138). However, no survival benefit was observed with tegafur/uracil compared with the surveillance group (p=0.891).
Comparison of survival curves for patients with R0-resected cholangiocarcinoma. (A) Overall survival. (B) Progression-free survival.

Comparison of overall survival for patients with R0-resected cholangiocarcinoma. (A) Patients with lymphovascular invasion. (B) Patients with perineural invasion. (C) Patients with American Joint Committee on Cancer (AJCC) stage I disease. (D) Patients with AJCC stage II disease.
Comparison of progression-free survival for patients with R0-resected cholangiocarcinoma. (A) Patients with lymphovascular invasion. (B) Patients with perineural invasion. (C) Patients with American Joint Committee on Cancer (AJCC) stage I disease. (D) Patients with AJCC stage II disease.
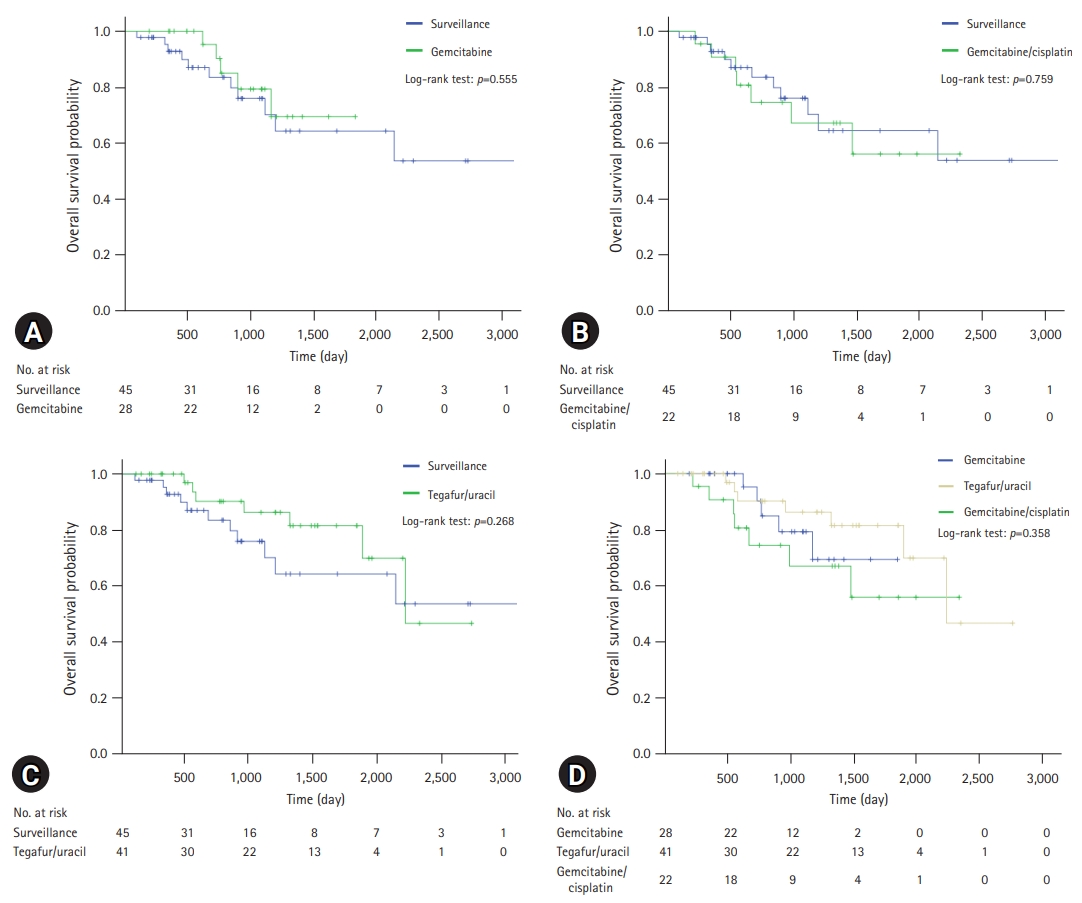
Comparison of overall survival for patients with R0-resected cholangiocarcinoma according to regimens. (A) Comparison between gemcitabine group and surveillance group. (B) Comparison between gemcitabine/cisplatin group and surveillance group. (C) Comparison between tegafur/uracil group and surveillance group. (D) Comparison of overall survival among regimens.
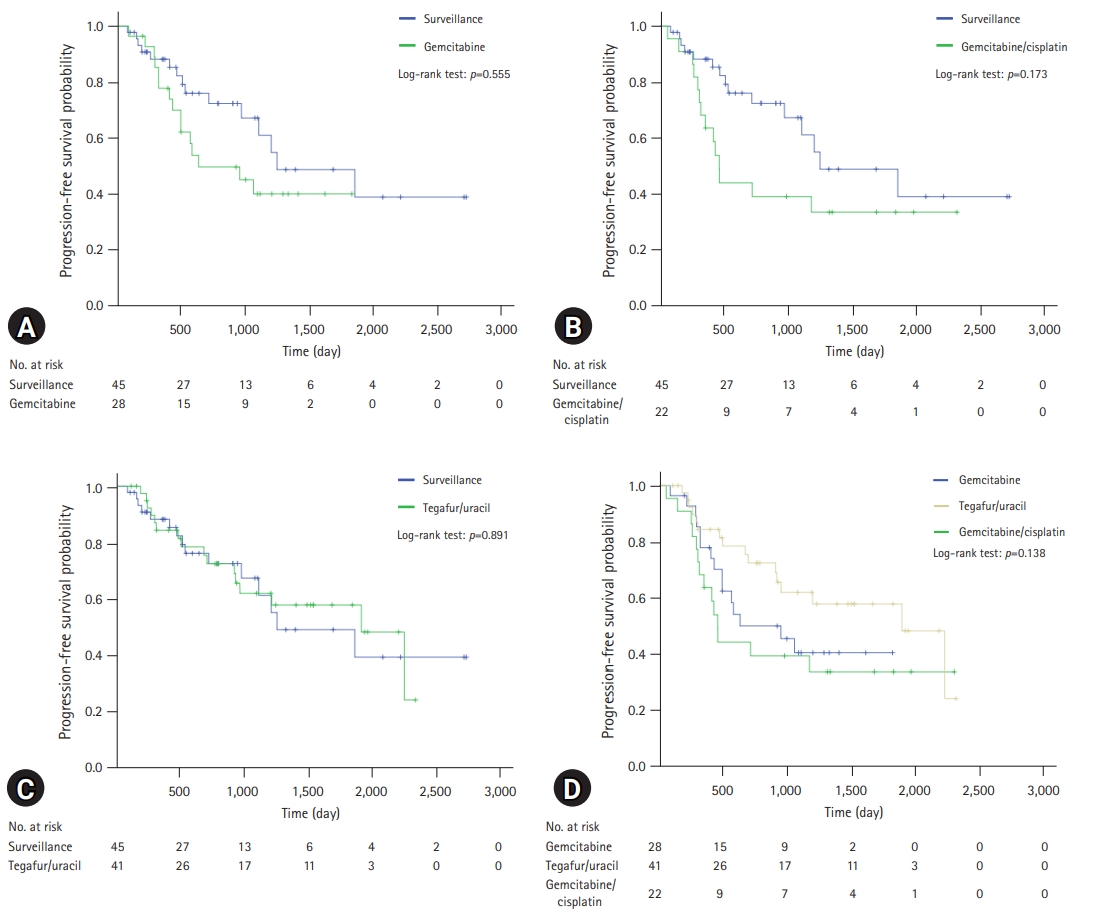
Comparison of progression-free survival for patients with R0-resected cholangiocarcinoma according to regimens. (A) Comparison between gemcitabine group and surveillance group. (B) Comparison between gemcitabine/cisplatin group and surveillance group. (C) Comparison between tegafur/uracil group and surveillance group. (D) Comparison of overall survival among regimens.
3. Prognostic factors associated with overall survival and progression-free survival
In the univariate analysis, CEA elevation (HR, 3.38; 95% CI, 1.30–8.74; p=0.012), lymphovascular invasion (HR, 2.11; 95% CI, 1.10–4.03; p=0.023), and AJCC stage III (HR, 9.81; 95% CI, 2.67–36.10; p<0.001) were useful prognostic factors for OS (Table 3). However, AT was not a statistically significant factor (HR, 0.92; 95% CI, 0.45–1.86; p=0.806). In the multivariate analysis, only AJCC stage III (HR, 10.81; 95% CI, 2.92–40.00; p<0.001) was a statistically significant prognostic factor associated with OS (Table 3). CA 19-9 elevation (HR, 1.80; 95% CI, 0.93–3.52; p=0.083) was useful but not statistically significant. Prognostic factors associated with PFS were analyzed and are shown in Table 4. In the multivariate analysis, ASA classification II (HR, 0.50; 95% CI, 0.31–0.81; p=0.005), AJCC stage II (HR, 3.14; 95% CI, 1.25–7.89; p=0.015), and AJCC stage III (HR, 8.08; 95% CI, 2.80–23.32; p<0.001) were significant prognostic factors for PFS (Table 4). Poorly differentiated cancer was statistically significant in the univariate analysis (HR, 1.92; 95% CI, 1.17–3.16; p=0.010), but not in the multivariate analysis (HR, 1.64; 95% CI, 0.98–2.75; p=0.060). As in the OS analysis, AT was not a statistically significant factor associated with PFS (HR, 1.57; 95% CI, 0.89–2.78; p=0.117).
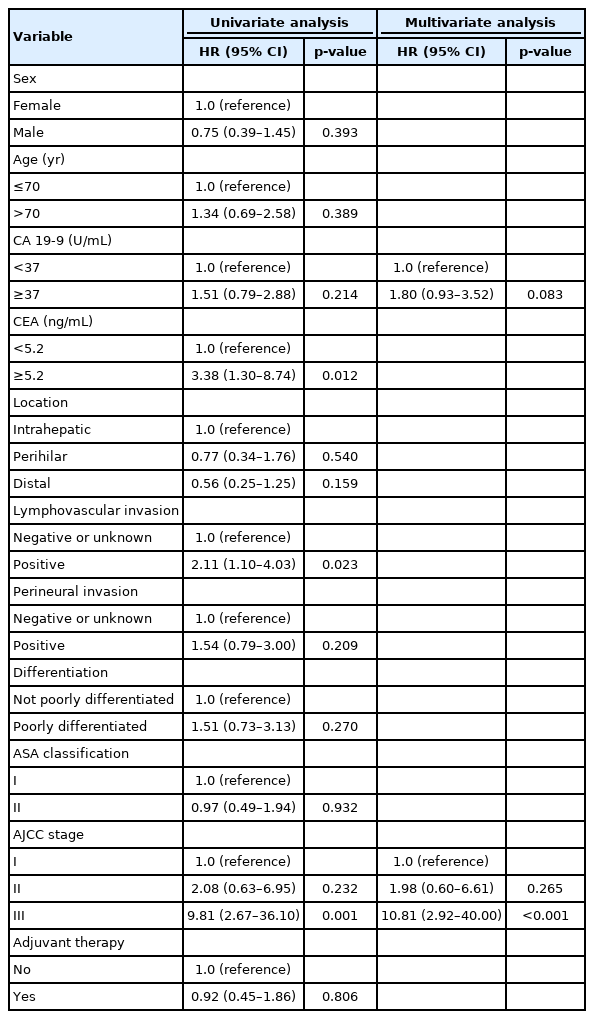
Prognostic factors associated with overall survival
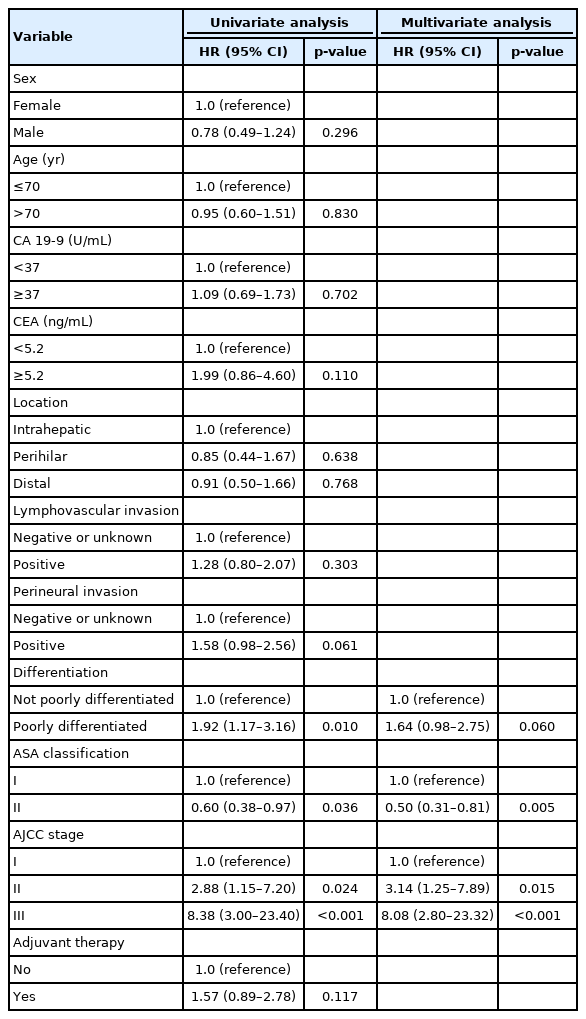
Prognostic factors associated with progression-free survival
4. Therapeutic adherence to adjuvant therapy according to regimen
Therapeutic adherence in the AT group according to the regimen is summarized in Table 5. Of the 109 patients who received AT, 72 (66.1%) completed the therapeutic schedule, and 37 (33.9%) did not finish the cycle. The reasons for cessation included recurrence (37.8%), patient refusal (24.3%), neutropenia (8.1%), and loss to follow-up (5.4%). Of the 109 patients who received AT, 36 (33.0%) received second-line therapy.

Clinical course of the adjuvant therapy group
Discussion
To our knowledge, there have been only five large prospective studies on adjuvant chemotherapy for CCA [6-10]. Only two of these studies showed positive results in patients who underwent surgery with curative intent, and these results were only marginally positive. In the ESPAC-3 trial, adjuvant chemotherapy was associated with increased OS in multivariate analysis (HR, 0.75; 95% CI, 0.57–0.98; p=0.03) [7], and in the BILCAP study, the median OS was 53 months in the capecitabine group and 17.5 months in the observation group (HR, 0.75; 95% CI, 0.58–0.97; p=0.028) in per-protocol analysis [8]. In contrast, retrospective studies of AT for CCA showed more positive results [11-18]. However, the subgroups that showed survival benefits differed among studies and included AJCC stage II and III biliary tract cancer [11], R1 resection or lymph node involvement [12], perineural invasion [13], and intrahepatic and AJCC stage III cancer [16]. There are two explanations for the inconsistent results among these studies. First, the CCA subtypes varied in each study. CCA is divided into three subtypes according to location, and each subtype has different characteristics, including risk factors and genetic aberrations [1]. Second, selection bias exists in retrospective studies. In the real world, patients considered to be at high risk of recurrence are likely to receive AT [13].
In this single-center analysis, AT did not demonstrate survival benefits. There are several possible explanations for this finding. First, all the patients included in this study underwent R0 resection. Previous studies on the effect of AT on R0-resected CCA are summarized in Table 6. Of these studies, four investigated R0 resection only [11,16-18], and the other two addressed it by subgroup analysis [9,20]. This shows that a survival benefit of AT in patients with R0-resected CCA has not been clearly demonstrated. Second, the CCA subtypes included in each study were different. For example, in previous studies in which AT showed positive results, the proportion of gallbladder cancer ranged from 13.6% to 48.3% [11-13,15]. However, patients with gallbladder cancer were not included in the present study. Third, differences in the AT regimen could be an important factor. Among several prospective studies, the only drug that showed an increase in OS was capecitabine [8]. However, none of the patients in the present study received capecitabine. Instead, patients who received tegafur/uracil, which is similar to capecitabine, showed the highest OSR and PFSR among the regimens, although the difference was not statistically significant. Furthermore, patients in the AT group had a more advanced AJCC stage, which was a significant prognostic factor for OS and PFS in this study.
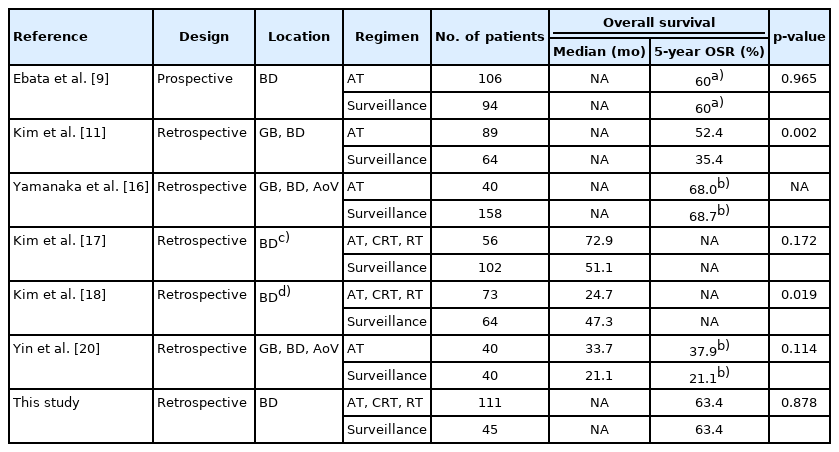
Studies about AT for R0-resected cholangiocarcinoma
Another possible explanation for the failure to demonstrate survival benefits is the low AT completion rate. In this study, one-third of the patients who received AT did not complete their planned schedule. This result is similar to that reported in recent studies (26.0%–53.7%) [8,10,15]. The goal of adjuvant chemotherapy is the eradication of micrometastasis, and it is important to achieve complete remission to increase survival [22]. From this perspective, completion of the therapeutic schedule is important. In this study, the second most common cause of cessation was patient refusal (21.7%). Toxicity, including cytopenia and skin eruptions, was also an important cause. These factors can be corrected with meticulous intervention. One example of this is individualized chemotherapy. The standard method for determining the dose of chemotherapy is based on the body surface area calculated using the patient’s weight and height [23]. However, several studies have reported improved clinical outcomes and reduced toxicity with individualized chemotherapy based on pharmacokinetic monitoring of the colorectal cancer [24,25].
In this study, PFSR tended to be lower in the AT group, although the difference was not statistically significant. This could be explained by two factors. First, the time interval of follow-up CT was shorter in the AT group, which might have allowed for the early detection of disease progression. Second, as noted previously, patients considered to be at high risk of recurrence are likely to receive AT [13]. To overcome this bias, a Cox proportional hazards model was used. In the multivariate analysis, AJCC stage III was a significant factor associated with OS. ASA classification II, AJCC stage II, and AJCC stage III were independent prognostic factors associated with PFS. Advanced AJCC stage was also identified as significant prognostic factor in previous studies [17,19]. In contrast, perineural and lymphovascular invasion were not statistically significant factors in this study. However, it should be taken into consideration that lymphovascular invasion and perineural invasion were unknown in 12.8% and 21.2% of the patients, respectively.
Interestingly, ASA classification was a favorable prognostic factor for PFS in this study. Chauhan et al. [26] reported that a high preoperative Charlson comorbidity index was an independent risk factor associated with significantly worse PFS (HR, 7.36; 95% CI, 2.68–12.12; p<0.001) in patients with R0-resected perihilar CCA. However, the patients included in the present study were either ASA classification I (normal healthy patients) or ASA classification II (patients with mild systemic disease, such as current smokers or those with obesity, well-controlled diabetes, hypertension, or mild lung disease) [27]. Therefore, additional research on the relationship between mild systemic diseases and PFS is required.
This study has several limitations. First, this was a retrospective study; thus, quality of life and adverse events were not investigated. The characteristics of both the AT and surveillance groups, including sex, age, and disease stage, were different owing to selection bias. Furthermore, the Eastern Cooperative Oncology Group performance status was not evaluated in most patients; therefore, ASA classification was used in this study instead. Second, it is difficult to generalize the results of this study because it was a single-center study. Third, capecitabine was not administered to the patients in this study. This is because capecitabine was approved by Korean Health Insurance in 2019. Fourth, patients with gallbladder cancer were excluded from the study. Finally, treatment and follow-up were performed at the discretion of the clinician. However, this study is meaningful because we analyzed adherence and the effect of AT in a real-world scenario with a large number of patients.
In conclusion, AT did not improve OS or PFS in patients with CCA who underwent R0 resection. AJCC stage III was a significant prognostic factor for OS. The prognostic factors associated with PFS were ASA classification II, AJCC stage II, and AJCC stage III. After adjusting for confounding variables using the Cox proportional hazards model, AT did not show any survival benefit. However, we found that AT was not completed in one-third of patients. Therefore, additional efforts are required to increase adherence to AT.
Notes
Conflicts of interest
No potential conflict of interest relevant to this article was reported.
Funding
None.
Author contributions
Conceptualization: all authors; Data curation: JL; Formal analysis: all authors; Methodology, Supervision: HGK, JH; Investigation: HTJ, JL, HHJ; Writing-original draft: HTJ; Writing-review & editing: HTJ, HHJ, HGK, JH.