A study on evaluator factors affecting physician-patient interaction scores in clinical performance examinations: a single medical school experience
Article information

Abstract
Background
This study is an analysis of evaluator factors affecting physician-patient interaction (PPI) scores in clinical performance examination (CPX). The purpose of this study was to investigate possible ways to increase the reliability of the CPX evaluation.
Methods
The six-item Yeungnam University Scale (YUS), four-item analytic global rating scale (AGRS), and one-item holistic rating scale (HRS) were used to evaluate student performance in PPI. A total of 72 fourth-year students from Yeungnam University College of Medicine in Korea participated in the evaluation with 32 faculty and 16 standardized patient (SP) raters. The study then examined the differences in scores between types of scale, raters (SP vs. faculty), faculty specialty, evaluation experience, and level of fatigue as time passes.
Results
There were significant differences between faculty and SP scores in all three scales and a significant correlation among raters’ scores. Scores given by raters on items related to their specialty were lower than those given by raters on items out of their specialty. On the YUS and AGRS, there were significant differences based on the faculty’s evaluation experience; scores by raters who had three to ten previous evaluation experiences were lower than others’ scores. There were also significant differences among SP raters on all scales. The correlation between the YUS and AGRS/HRS declined significantly according to the length of evaluation time.
Conclusion
In CPX, PPI score reliability was found to be significantly affected by the evaluator factors as well as the type of scale.
Introduction
Establishing major competencies and training for clinical performance in medical education has been prevalent in Korea for only the last 15 years. This is due to the clinical skills test that was added to the paper-based Korean Medical Licensing Examination (KMLE) in 2009. This crucial change in the KMLE has strengthened clinical performance in Korean medical schools.
Yeungnam University has also conducted regional consortiums in training and its evaluation of clinical performances bi-annually. The consortium is primarily intended for educational feedback, so after conducting a similar evaluation of the KMLE, not only individual student feedback but also school feedback will be obtained.
The clinical skills test is consisting of the objective structured clinical examination (OSCE) and clinical performance examination (CPX). In evaluating communication skills and attitude by the standardized patient (SP), Yeungnam University employs five to six items that are the same as the physician-patient interaction (PPI) scales on the KMLE. These items include effective questioning, careful listening, a patient-centered attitude, using words precisely, and rapport building. In the physical examination station, another item has been included to assess a good manner during physical examination. Even though the six items of the PPI evaluation are based on global rating forms, the assessment guidelines and evaluation criteria for each question are quantitative rather than qualitative. They endeavor to establish an objective evaluation according to the checklist developed for this purpose. Faculty raters evaluate technical skills; SP raters evaluate PPI for the same students. This evaluation process is based on multiple studies conducted on the accuracy of information provided by trained SP raters and derived from SP assessments [1-3].
In general, the degree of agreement between faculty and SP scoring is 80% to 100%. However, research has shown inconsistencies in SP evaluations in Korea for 2,000, although SP score are higher than faculty scores. For example, in the study of Park et al. [4], the degree of agreement among the evaluations was 71% to 82%; the correlation among those evaluations appeared to have a 36% to 42% reliability, and the actual correlation itself was 0.60 to 0.65. The study of Kim et al. [5] regarding 14 evaluation items shows a significant difference between faculty and SP evaluations. In other studies, the correlation between faculty raters and SP raters for PPI was 0.54, which was lower than that in other regions [6,7]. Numerous researchers agree that the differences among the raters are due to a lack of explicit criteria and training experience, the rater’s level of fatigue, and the number of items and rating scales [8,9].
Since 2010, however, there has not been enough exploratory research into the characteristics of these assessors or their reliability. This is the primary reason for the current study—to remedy evaluation methods, assessment skills, and training for raters. To accomplish reliable PPI evaluations, we compared faculty evaluations using the Yeungnam University Scale (YUS), analytic global rating scale (AGRS), and holistic rating scale (HRS) [10] with SP evaluation scores. In addition, research was conducted on the differences in faculty specialty and rater’s experiences, as well as the rater’s level of fatigue as time passes.
The research problems of this study are as follows: are there any differences in PPI scores between faculty raters and SP raters; what are the differences in PPI scores based on the faculty raters’ specialty? What are the differences in PPI scores according to the raters’ evaluation experience? Are the scores consistent from beginning to end during long evaluation times?
Materials and methods
1. Procedure and participants
The present study protocol was reviewed and approved an exemption of informed consent by the Institutional Review Board of Yeungnam University Hospital (IRB No: 7002016-E-2015-001).
For this study, we analyzed the PPI evaluation in the CPX that was conducted among third-year students at Yeungnam University College of Medicine in 2013. The evaluation was conducted on December 16 and 17. In total, 72 students were enrolled; there were 51 males (70.8%) and 21 females (29.2%) whose average age was 22.45 years. The group was subdivided randomly into 12 teams consisting of six members each. A total of 12 stations were set up to evaluate the CPX over 2 days; two copies of six stations were assigned each morning and afternoon.
To assess the reliability of the evaluation process, faculty raters and SP raters conducted the PPI evaluation simultaneously in each station; 48 faculty raters and 24 SP raters took part in the evaluations. Before the examination, all raters were trained for 2 hours on the general assessment process and the criteria for scoring assigned stations. We analyzed the evaluation results of eight stations, excluding four stations that did not have a complete scoring process. Consequently, we analyzed the final data based on evaluations conducted by 32 faculty and 16 SP raters. Of the 32 faculty raters, 12 evaluated stations related to their specialty while the other 20 evaluated stations out of their specialty. Nine had majored in basic medical science and 23 in clinical medicine. On average, faculty raters had participated in evaluation 5.13 times, while the average evaluation experience of SP raters was 7.44 times. Finally, the eight stations we examined included: jaundice, antenatal care, adult immunization, drinking problems, low back pain, micturition disorder, convulsion in childhood, and mastodynia/breast mass.
2. Research instruments
For this study, three rating scales were employed. The first scale, the YUS, was developed by the Daegu-Gyeungbuk regional consortium in Korea and revised by the Yeungnam University College of Medicine. The YUS consists of six items worth four points each; effective questioning, careful listening, patient-centered attitude, using words precisely, rapport building, and a good manner during physical examination. Also, the uniqueness of this rating scale is that it is similar to the global rating; however, it has been developed as a quantitative criterion to ensure evaluation objectivity. Table 1 shows an example of YUS. As a second scale, we employed four questions from AGRS developed by Hodges and McIlroy [10]. The AGRS consists of the following four items worth five points each; response to patient’s feelings and needs, degree of coherence in the interview, verbal expression, and non-verbal expression. This scale used qualitative criteria to assess the above items. Finally, the one-item HRS was employed as an additional question for the overall assessment of the knowledge and skills. Table 2 shows an example of AGRS and HRS.
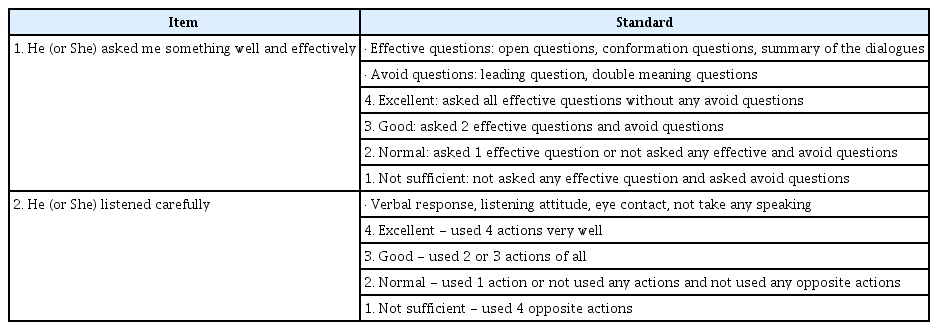
An example of evaluation standards of Yeungnam University Scale
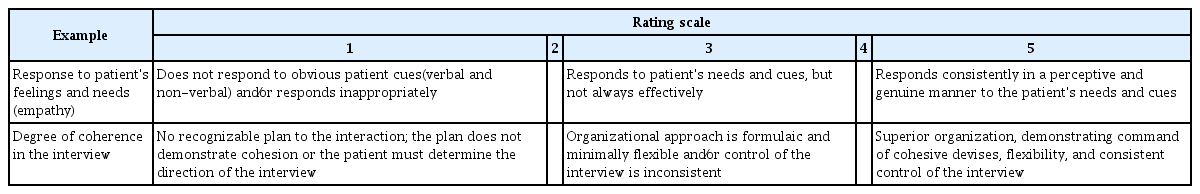
An example of evaluation standards of analytic global rating scale and holistic rating scale
3. Analysis
Regarding the 72 students’ clinical performance, we compared differences in final scores using the rater’s assessment expertise, rating experience, and the level of fatigue. Initially, all test items used T-score as a standard; the scores of YUS, AGRS, and HRS were compared with the average scores of the overall test items. In addition, we compared the faculty rater’s scores with those of the SP raters for each of the evaluations. We also compared scores of the faculty raters who assessed stations related to their specialty with the scores of those who assessed stations out of their specialty and the differences between basic medical science and clinical medicine specialties. We proceeded with comparing score differences based on rater evaluation experience divided into three categories; less than three times, three to 10 times, and more than 10 times.
Furthermore, we examined the correlation coefficient based on the SP rater’s level of fatigue. To test these group differences, the T-test and F-test were used. To verify differences based on SP rater fatigue, we compared the results of SPs who were assigned during the morning or afternoon with those who participated all day. Moreover, we looked at the correlation differences among all scales.
Results
A comparison of raters’ scores based on the evaluation tools for each item and the inter-rater correlation coefficient are shown in Table 3 and Fig. 1. The results show significant differences in scores between faculty and SP raters according to the evaluation tools. The scores of SP raters were significantly higher than those of the faculty raters; YUS (t=–18.23, p<0.001), AGRS (t=–10.24, p<0.001), and HRS (t=–3.20, p<0.01), respectively. Correlation coefficients between the faculty and SP raters were the following: YUS, 0.49 (p<0.001); AGRS, 0.34 (p<0.01); and HRS, 0.40 (p<0.001), respectively. These results indicate a significant correlation among the raters’ scores based on each evaluation tool.
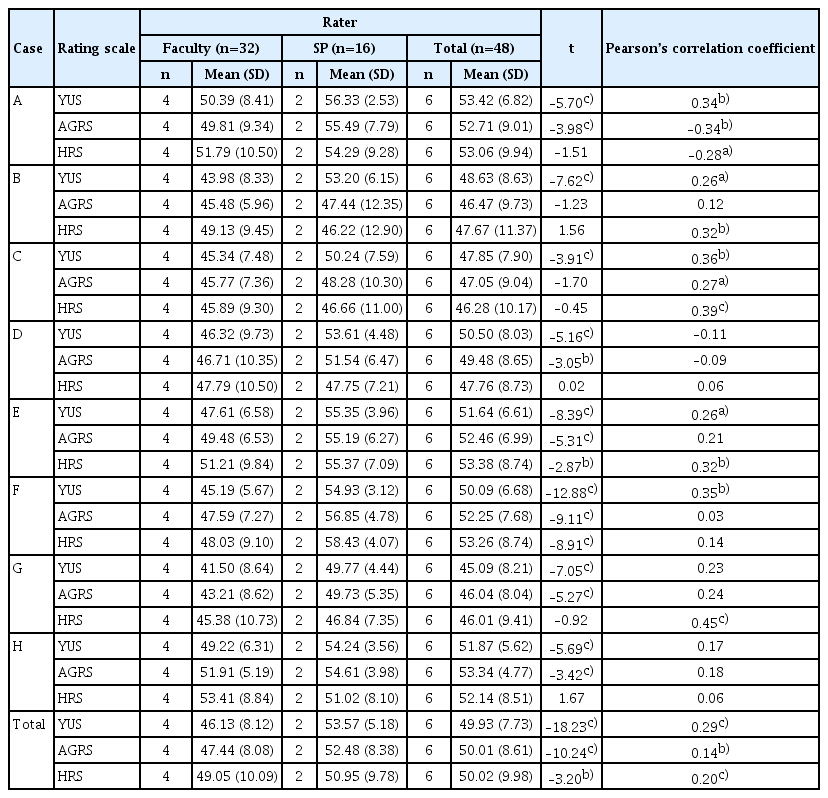
Comparisons of rating scales and Pearson’s correlation coefficient of raters
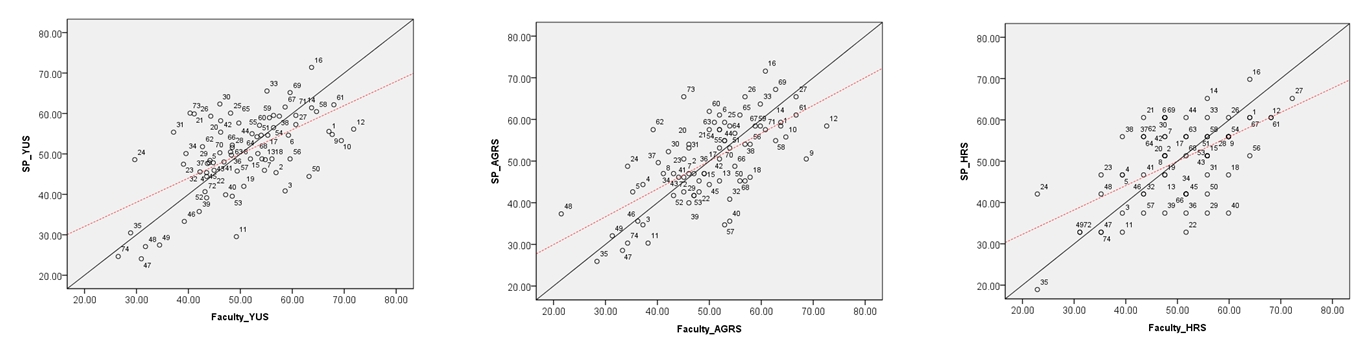
X-Y scatter plot with scores of faculty and standardized patient. SP, standardized patient; YUS, Yeungnam University Scale; AGRS, analytic global rating scale; HRS, holistic rating scale.
The results of the score differences according to the major congruence of the raters who assessed items related to their specialty and those who assessed items out of their specialty are in Table 4. There was a significant difference between the YUS (t=–3.61, p<0.001) and the AGRS (t=–2.73, p<0.01). The scores of the raters who assessed stations related to their specialty were lower than those of the raters who assessed stations out of their area of specialty. In the case of HRS, there was no significant difference.
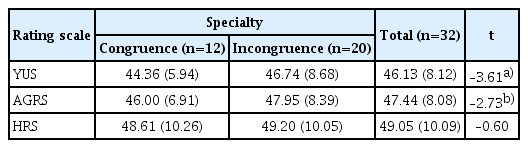
Comparisons of scores according to the congruence of the raters’ specialty
Table 5 shows the results of score differences according to raters’ evaluation experiences. In the YUS and AGRS, significant differences based on the faculty’s evaluation experience were observed. It was observed that the scores from those who had participated 3–10 times group were lower than those from the other two groups. In all scales, there were significant differences among the SP raters. However, for the SP raters, scores from those who had participated 3–10 times were higher than those from the other groups.
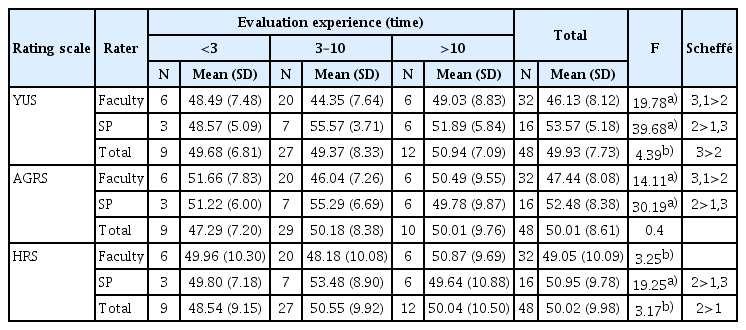
Comparisons of scores between evaluation experiences of faculty raters and standardized patients
The reviewed correlation between three rating scales in each group of raters is shown in Table 6. In the results of the correlation between the rating scales, the following were observed; 0.66 to 0.83 in faculty (p<0.001) and 0.68 to 0.82 in SP (p<0.001).

Comparisons of correlation between three rating scales in each group of raters
To find the impact of the raters’ level of fatigue on evaluation outcome, we compared the scores given by SP raters in the morning and afternoon. The results are shown in Table 7. The correlation between the YUS and AGRS and between the YUS and HRS were significantly lower in the afternoon than in the morning.

Comparisons of correlations between morning and afternoon in standardized patient raters
Discussion
Analyzing the differences between the evaluation results of the three assessment tools and the raters’ characteristics, we have explored factors that may affect PPI scores. This study was conducted to minimize the effects of co-factors to secure fairness. Therefore, this study tried to find out the difference between evaluation results according to the characteristics of evaluators and evaluation tools and discuss the implications of each result.
The result of this study showed that there was a slight difference in PPI scores between faculty raters and SP raters. In general, when there was a significant difference, the evaluation scores of SPs were significantly higher than that of the faculty. These results were similar to previous studies due to the SP role, which was not primarily for evaluation purposes but rather for constructive educational feedback. Hence, SPs are not comfortable with giving low scores. However, faculty raters deal with subjects with which they are familiar; consequently, they can be better focused and stricter in their evaluation [11-13]. In addition, concerning the YUS, AGRS, and HRS scores, Pearson’s correlation coefficient between the faculty and SP raters was 0.34 to 0.49. In the study of Kwon et al. [6], the results of the CPX concerning technical skill items-history taking, physical examination, and patient education-showed correlation coefficient from 0.69 to 0.91. In contrast, the correlation for the patient-doctor relationship was somewhat low; 0.09 to 0.51. The reasons for these results could be found in ambiguous applied standards, the level of raters’ fatigue, and lack of training [6-9,14]. For additional improvement of the evaluation process, this study recommends periodic evaluation of raters and further training tasks.
The SPs involved in this study had participated in PPI evaluations using the YUS an average of 7.44 times and had at least 3 to 12 hours of training according to the training guidelines set by the consortium. However, in the training for the AGRS and HRS, the instruction portion involved less than three hours of training. Furthermore, the raters’ fatigue from having to assess on all three scales could affect the evaluation outcome. In the case of faculty raters, even though they had an average of 5.13 evaluation experiences, their previous experience was limited only to evaluating technical skills; thus, they did not have proper training in conducting PPI evaluations. Since the pre-evaluation training for this study was completed in only one hour, overall training for the evaluation process was insufficient. There is another possibility that the raters’ fatigue level was high because we conducted the technical skill and PPI evaluations together. The fact that the reliability among the scales evaluated in the afternoon is lower than that in the morning can be interpreted as an increase in the fatigue of the evaluator and a decrease in concentration. Therefore, it is necessary to arrange evaluators separately in the afternoon or provide sufficient rest time.
There were significant differences in the scores related to the raters’ specialty and in scores between basic medical science and clinical medicine. Regarding the evaluation experience, the scores showed significant differences among each faculty and SP group. In the case of the faculty, the scores of evaluators with 3–10 evaluation experiences were significantly lower than those with less than three or more than 10 evaluation experiences. However, in the case of SPs, the evaluation scores of evaluators with 3–10 experiences were significantly higher than those with less than three or more than 10 evaluation experiences. These results are the same for all YUS, AGRS, and HRS evaluations.
According to these results, it was found that the faculty members were more thoroughly assessed if their majors matched, or if they had more than three or less than 10 evaluation experiences. However, SPs appeared to be less thorough, as they became accustomed to evaluation and became more involved when they had three to 10 evaluation experiences. To offset these differences and increase reliability, we need to strengthen the rater’s competences through systematic strategies during their training and feedback. In addition, it is necessary to systematically apply a statistical method to offset the score difference between evaluators. Accordingly, in medical schools, it is necessary to train or acquire evaluation experts or analysis experts, and it is necessary to secure an evaluation system or an evaluation support team that is capable of systematic evaluation support.
Besides, in Korea, technical skills are assessed by faculty, but humanistic skills are assessed by SPs. The faculty raters tend to over-emphasize the importance of technical skills and, thus, evaluate them more strictly. However, they are inclined to be laxer and more generous when evaluating humanistic skills because they would feel awkward doing otherwise [15]. Moreover, Park et al. [7] reported lower PPI scores from SP evaluators through comparative studies on the accuracy of scoring by faculty and SPs on the CPX, confirming that there are also differences between evaluators who are simply observant or participatory. This means that it may also depend on the extent of the evaluator’s subjective intervention, and therefore, accurate feedback on humanistic skills can be hindered in the process of evaluation feedback and retraining. Hence, faculty raters need to recognize the importance of humanistic skills and feedback for their results. Separate sessions of technical and humanistic skills on the CPX needs to be examined closely; both adequacy and reliability should be reviewed.
This study also tried to explore the appropriateness of the evaluation tool. Numerous previous studies on the subject report that the global rating is similar to the checklist or even superior in validity and reliability. Furthermore, to evaluate students’ performance, they recommend using the checklist and the global rating scale together [11,16-18]. The checklist is primarily known for the evaluation of technical skills, including procedural performance. However, the global rating scale is known as an efficient tool to measure a student’s attitudes and PPI, communication skills, and possible expertise [16,18-23]. Therefore, as far as humanistic skills are concerned, it is appropriate to employ the global rating scale for the PPI.
The worksheet has been developed as a checklist, although the PPI evaluation scales include global rating scale items at the Yeungnam University College of Medicine. This is because the checklist is superior in apparent objectivity and ease of use [24]. However, the checklist form of the worksheet may be more appropriate for the technical skills station, and the global rating form may be more appropriate for attitudes in the PPI station [25]. Generally, raters who use the checklist are inclined to give the same scores to the students whether they performed well [26]. In this study, one of the SPs reported that there were students who were not satisfied with the overall physician-patient relationship, although she gave high scores for a lack of demerit factors according to the checklist.
In addition, students tend to memorize the checklist rather than practice technical skills in the process of preparing for the OSCE [27]. In this context, the phenomenon diminishes the value of education; specifically, it reduces the validity of assessing students’ competence [12]. It is therefore imperative that we provide improved assessment tools for students so that the skills are embodied rather than a simple recitation of a memorized PPI checklist. Furthermore, it is necessary that students internalize the correct attitude in their practice. Thus, we propose a further study on how to improve evaluation tools and standards as a form of the AGRS.
In this study, SP assesses an average of six students at one station. We compared the correlations among the individual assessment scales, dividing the process into two different time periods-morning and afternoon-to find out the potential impact that raters’ fatigue can have on the scores. We found a significant difference in the correlation between YUS and AGRS, and between YUS and HRS. Scores given in the afternoon session were lesser reliable than those given in the morning, which is statistically significant. Indeed, it is hard to stay focused on evaluations for a long time. The rater’s fatigue, caused by the multitude of evaluation items and the number of students to evaluate, is responsible for the failure to maintain consistency [28-30]. To enhance the degree of consistency among raters, a strategy to lengthen the training period but reduce the time that raters spend on assessments could be proposed. Furthermore, specific ways could be proposed to use professional SPs more efficiently. As described above, SP evaluators received 3 to 12 hours of pre-training for CPX evaluation whereas faculty members received only one hour of pre-training. The reason for the low correlation between evaluation scores between faculty members and SP evaluators may also be because the standardized evaluator education was not conducted equally. It is suggested that systematic training is required for all evaluators to increase the reliability of evaluation scores.
This study based on one CPX assessment conducted at a school, and it is focused on the evaluation of the patient-doctor relationship rather than the clinical performance process. Due to temporal and financial limitations in the actual evaluation, two SPs participated in one clinical item evaluation, while four professors participated in the same evaluation. Therefore, the decrease in reliability for the evaluation tools of SP evaluators in the afternoon may be due to the increased fatigue.
Although the correlation was a little low, it was considered that the correlation between faculty and SP evaluators was higher when YUS was used than when AGRS or HRS were used. In the actual evaluation situation, ease of evaluation is considered as an important factor, and the evaluation tools with high validity and reliability with a few evaluation items are preferred. It is recommended to use HRS for the ease of evaluation, but it can be seen that the use of AGRS or YUS that comprises four to six items may be more appropriate to compensate for the limitations regarding single-item measurement. The most appropriate evaluation tool should be suitable in the form and number of evaluation items, and both evaluation validity and reliability must be satisfied. Therefore, it is necessary to continuously study which evaluation tools are useful for evaluating according to various evaluation situations and clinical presentations.
The limitations of this study are as follows: First, this cannot be generalized because it based on the experience of a single school. Second, it is a retrospective study, not a study designed to identify only the factors that affect PPI scores. Third, this is a separate analysis of the PPI scores only, which are parts of the station for CPX. Therefore, it did not reflect the impacts of the characteristics (e.g., difficulty level, etc.) of each station. Finally, it did not reflect the personal characteristics (e.g., beliefs, emotional state, fatigue level, etc.) of raters on the day of assessment.
In conclusion, the reliability of PPI scores on the CPX was found to be significantly affected by evaluator factors as well as the type of scale used. There is a need for a further study to establish guidelines for evaluating PPI on the CPX and to offer appropriate assessment tools, an ideal number of items, raters’ qualification, and ideal length of evaluation time.
Notes
Conflicts of interest
No potential conflict of interest relevant to this article was reported.
Funding
This research was supported by a grant of Yeungnam University Medical Center (2011).
Author contributions
Conceptualization and Validation: all authors; Project administration: KSL, YHL; Funding acquisition: YHL; Data curation and Formal analysis: KHC, YSP; Writing-original draft: YSP, KSL; Writing-review & editing: all authors.