Telmisartan increases hepatic glucose production via protein kinase C ζ-dependent insulin receptor substrate-1 phosphorylation in HepG2 cells and mouse liver
Article information

Abstract
Background
Dysregulation of hepatic glucose production (HGP) contributes to the development of type 2 diabetes mellitus. Telmisartan, an angiotensin II type 1 receptor blocker (ARB), has various ancillary effects in addition to common blood pressure-lowering effects. The effects and mechanism of telmisartan on HGP have not been fully elucidated and, therefore, we investigated these phenomena in hyperglycemic HepG2 cells and high-fat diet (HFD)-fed mice.
Methods
Glucose production and glucose uptake were measured in HepG2 cells. Expression levels of phosphoenolpyruvate carboxykinase (PEPCK) and glucose-6-phosphatase α (G6Pase-α), and phosphorylation levels of insulin receptor substrate-1 (IRS-1) and protein kinase C ζ (PKCζ) were assessed by western blot analysis. Animal studies were performed using HFD-fed mice.
Results
Telmisartan dose-dependently increased HGP, and PEPCK expression was minimally increased at a 40 μM concentration without a change in G6Pase-α expression. In contrast, telmisartan increased phosphorylation of IRS-1 at Ser302 (p-IRS-1-Ser302) and decreased p-IRS-1-Tyr632 dose-dependently. Telmisartan dose-dependently increased p-PKCζ-Thr410 which is known to reduce insulin action by inducing IRS-1 serine phosphorylation. Ectopic expression of dominant-negative PKCζ significantly attenuated telmisartan-induced HGP and p-IRS-1-Ser302 and -inhibited p-IRS-1-Tyr632. Among ARBs, including losartan and fimasartan, only telmisartan changed IRS-1 phosphorylation and pretreatment with GW9662, a specific and irreversible peroxisome proliferator-activated receptor γ (PPARγ) antagonist, did not alter this effect. Finally, in the livers from HFD-fed mice, telmisartan increased p-IRS-1-Ser302 and decreased p-IRS-1-Tyr632, which was accompanied by an increase in p-PKCζ-Thr410.
Conclusion
These results suggest that telmisartan increases HGP by inducing p-PKCζ-Thr410 that increases p-IRS-1-Ser302 and decreases p-IRS-1-Tyr632 in a PPARγ-independent manner.
Introduction
The anabolic hormone insulin promotes not only glucose uptake and utilization in skeletal muscles and adipose tissues but also represses glycogenolysis and gluconeogenesis in the liver that is a central organ for gluconeogenesis in the body (approximately 90% of endogenous glucose production) [1,2]. Thus, hepatic dysregulation of gluconeogenesis is considered to contribute to the development of insulin resistance and type 2 diabetes mellitus [2,3].
Once insulin binds to the insulin receptor (IR), the IR is autophosphorylated and activated, which mediates tyrosine phosphorylation of various downstream molecules including the insulin receptor substrate (IRS) [3,4]. Although at least six IRS isoforms (IRS-1 to -6) have been identified [4], IRS-1 has been revealed to play an important role in mediating insulin action [5,6]. In addition to its regulation by gene expression, IRS-1 activity is largely regulated by its extensive phosphorylation [4,5]. Tyrosine phosphorylation of IRS-1 is generally stimulatory (i.e., Tyr632 and Tyr896), whereas serine phosphorylation is mainly inhibitory (i.e., Ser302, Ser307, and Ser1101) [4,5]. Numerous kinases such as phosphatidylinositide 3-kinase (PI3K), Akt, protein kinase C (PKC), mammalian target of rapamycin, p60 S6 kinase, and glycogen synthase kinase-3β (GSK3β) have been identified as responsible kinases for IRS-1 serine phosphorylation [5,7]. Of these, PKC-mediated serine phosphorylation of IRS-1 is widely reported to negatively regulate insulin signaling, which consequently contributes to the development of insulin resistance [7].
Telmisartan belongs to the class of angiotensin II type 1 receptor blockers (ARBs) and is widely used for the treatment of patients with hypertension with concomitant diabetes mellitus [8]. Unlike other ARBs, telmisartan exhibits various ancillary effects including improvement of insulin resistance and cardiometabolic profile [9-11]. Telmisartan is reported to improve insulin resistance in skeletal muscles via peroxisome proliferated-activated receptor δ (PPARδ) [12], and adipose tissues by elevating adiponectin and reducing pro-inflammatory cytokines [13]. However, the effects of telmisartan on hepatic glucose production (HGP) and its underlying mechanism have not been fully elucidated. In this study, we investigated these effects, including molecularly, using hyperglycemic HepG2 cells and high-fat diet (HFD)-fed mice, and demonstrated that telmisartan increased HGP by inducing p-PKCζ-Thr410, which increased p-IRS-1-Ser302 and decreased p-IRS-1-Tyr632 in a PPARγ-independent manner and, consequently, impaired insulin action in HepG2 cells and the mouse liver.
Matrials and methods
Telmisartan and losartan were purchased from Cayman Chemical (Ann Arbor, MI, USA). Fimasartan was a kind gift from Boryung Pharmaceutical (Seoul, Korea). D-Glucose, GW9662, sodium lactate, HEPES, dimethyl sulfoxide (DMSO), and bovine insulin were obtained from Sigma-Aldrich (St. Louis, MO, USA). Antibodies against Akt, p-Akt-Ser473, GSK3β, p-IRS-1-Ser302, p-IRS-Ser307, p-IRS-Ser318, p-IRS-Ser1101, p-IRS-Tyr632, p-IRS-Tyr896, IRS-1, and actin were purchased from Cell Signaling Technology (Boston, MA, USA). Antibodies against glucose-6-phosphatase α (G6Pase-α), phosphoenolpyruvate carboxykinase (PEPCK), and PKCζ, p-PKCζ-Thr410 were purchased from Santa Cruz Biotechnology (La Jolla, CA, USA). Antibodies against p-GSK3β-Ser9 and hemagglutinin (HA) were obtained from BD Biosciences (San Jose, CA, USA) and Covance Inc. (Emeryville, CA, USA), respectively. Low or high glucose Dulbecco’s modified Eagle’s medium (DMEM) and Dulbecco’s phosphate-buffered saline were purchased from Welgene Inc. (Gyeongsan, Korea). Sodium pyruvate, fetal bovine serum (FBS), penicillin and streptomycin antibiotics, L-glutamine, and trypsin-EDTA solution were purchased from Gibco-BRL (Gaithersburg, MD, USA). Plasticware for cell culture was purchased from Corning Inc. (Oneonta, NY, USA) or SPL Life Sciences (Pocheon, Korea). All other chemicals were of the purest analytical grade.
1. Cell culture and drug treatment
The human HepG2 hepatoma cell line was a generous gift from Prof. Jiyeon Kim (Eulji University, Daejeon, Korea). HepG2 cells were maintained in high glucose (25 mM) DMEM supplemented with 10% FBS at 37°C in an atmosphere of 5% CO2 in air and the cells were passaged every 3 days by trypsinization. For the experiments, HepG2 cells grown to 70% confluence were incubated in serum-free normal glucose (5.5 mM) DMEM in a six-well plate overnight. After further culture in serum-free normal or high glucose DMEM containing various concentrations of telmisartan for 24 h, the cells were cotreated with 100 nM insulin for a further 10 min. In some experiments, HepG2 cells were cotreated with the indicated drugs or chemicals for the specified time.
2. Dominant negative (dn)-PKCζ gene transfection
The HA-tagged rat dn-PKCζ construct (K281R) was transfected into HepG2 cells as described in our previous report [14,15] with minor modifications. Briefly, HepG2 cells were seeded in a six-well plate as described above and transfected with 1.5 μg pcDNA3.1 vector containing dn-PKCζ cDNA using Lipofectamine 2000 (Invitrogen, Carlsbad, CA, USA) according to the manufacturer’s instructions. For the control, equal amounts of the pcDNA3.1 vector were transfected. After incubation for 5 h at 37°C, the cells were further incubated in normal glucose DMEM containing 10% FBS overnight before use for further experiments.
3. Western blot analysis
For the western blot analysis, cells treated with telmisartan in the absence or presence of various chemicals were lysed in lysis buffer (20 mM Tris-HCl pH 7.5, 150 mM NaCl, 1% Triton X-100, 1 mM EDTA, 1 mM EGTA, 1 mM PMSF, 10 mM β-glycerophosphate, 1 mM NaF, 1 mM Na3VO4, and 1× protease inhibitor cocktail [Roche Molecular Biochemicals, Indianapolis, IN, USA]). In addition to HepG2 cells, the mouse livers used were dissected, and the proteins were extracted by chopping the tissue using iris scissors in ice-cold lysis buffer. The protein concentration was measured using a BCA protein assay kit (Thermo Scientific, Rockford, IL, USA). Equal quantities of protein (20 μg) were electrophoretically separated on a sodium dodecyl sulfate-polyacrylamide gel and then transferred onto a nitrocellulose membrane (GE Healthcare Life Sciences, Pittsburgh, PA, USA). The blots were then probed with appropriate antibodies, followed by the corresponding secondary antibodies (Invitrogen), and finally developed using ECL reagents (Amersham Biosciences, Arlington Heights, IL, USA).
4. Glucose uptake assay
For glucose uptake measurements, HepG2 cells grown to 70% confluence in six-well plates were serum starved overnight and then incubated in serum-free high glucose DMEM containing various concentrations of telmisartan for 24 h. The medium was replaced with Krebs-Ringer-phosphate-HEPES (KRPH) buffer (10 mM HEPES, pH 7.4, 136 mM NaCl, 4.7 KCl, 5 mM KH2PO4, 1 mM MgSO4, 1 mM CaCl2, and 2% bovine serum albumin) for glucose starvation for 40 min. The cells were treated with 100 nM insulin for 10 min, and then 10 mM 2-deoxyglucose was added to the medium for an additional 20 min. Cell lysates were obtained, and a colorimetric glucose uptake assay was performed using a glucose uptake assay kit (Abcam, Cambridge, UK) according to the manufacturer's instructions. The uptake of glucose was normalized to the total protein content determined from the whole-cell lysates.
5. Glucose production assay
For the glucose production assay, HepG2 cells grown to 70% confluence were serum starved overnight, and the cells were further incubated in serum-free normal or high glucose DMEM containing various concentrations of telmisartan for 24 h. The medium was then replaced with glucose production buffer containing 2 mM sodium pyruvate, 20 mM sodium lactate, and 100 nM insulin for 4 h. The glucose production buffer was collected, and glucose concentration was measured using a colorimetric glucose assay kit (Cayman, Ann Arbor, MI, USA) according to the manufacturer's instructions. The glucose amounts were normalized to the total protein content determined from the whole-cell lysates.
6. Animal studies
Male C57BL/6 mice were purchased from Orient Bio Inc. (Seoul, Korea) and housed in a temperature-controlled facility with a 12-h light–dark cycle. The mice were provided ad libitum access to normal chow and water until 6 weeks of age, and then they were started on an HFD (D12492, 60% fat kcal; Research Diets Inc., New Brunswick, NJ, USA) for 13 weeks, followed by randomization to either the vehicle (DMSO)-treated (n=5) or telmisartan-treated (n=6; 5 mg·kg body weight-1·day-1) group. Animals were treated by oral gavage and fed the HFD for an additional 5 weeks. The mice were euthanized and their livers were dissected. All the experimental procedures were performed in accordance with protocols approved by the Institutional Animal Care and Use Committee at the Soonchunhyang University (Approval no. SCH16-0002).
7. Statistical analysis
All results are expressed as the means±standard deviation (SD). Significant differences were identified using the Student’s t-test for two points. All differences were considered significant at p<0.05.
Results
1. Telmisartan increases glucose production by increasing p-IRS-1-Ser302 and decreasing p-IRS-1-Tyr632 in hyperglycemic HepG2 cells
We first examined the effect of telmisartan on glucose production in normoglycemic or hyperglycemic HepG2 cells. In the presence of insulin treatment, telmisartan dose-dependently increased glucose production in hyperglycemic but not normoglycemic HepG2 cells (Fig. 1A). Therefore, all subsequent experiments were performed under hyperglycemic conditions. Next, we assessed the expression of G6Pase-α and PEPCK that are critical enzymes for hepatic gluconeogenesis. As shown in Fig. 1B, telmisartan at 40 μM slightly increased PEPCK expression without dose-dependency, while G6Pase-α expression was not altered by telmisartan. Although hepatic glucose uptake is considered to be unchanged by insulin [3], glucose-induced nitric oxide has been reported to stimulate Glut4 synthesis and glucose uptake in hepatocytes [16]. Therefore, we determined whether telmisartan increased glucose uptake under our experimental conditions to rule out the possibility that glucose production may be affected by increased glucose uptake. Telmisartan at 40 μM decreased glucose uptake and Glut4 expression but not Glut2 (Supplementary Figs. 1A, 1B), indicating that telmisartan-induced glucose production was largely caused by enhanced hepatic gluconeogenesis rather than glucose uptake. Our results showed a concentration-dependent telmisartan-induced increase in glucose production but not PEPCK expression (Figs. 1A, 1B), and a previous study reported that PEPCK expression does not exclusively contribute to hepatic gluconeogenesis [17]. These observations prompted us to investigate the molecular mechanism of the telmisartan-induced HGP by first examining phosphorylation states of Akt and GSK3β, because the increased phosphorylation of the proteins mediates insulin action [18]. Unexpectedly, telmisartan dose-dependently increased p-Akt-Ser473 and p-GSK3β-Ser9 (Supplementary Fig. 2), with insulin treatment. In an attempt to identify the signaling pathway mediating the effects of telmisartan, we examined the phosphorylation status of IRS-1, because it is essential and the critical molecule mediating insulin action, and IRS-1 activity is largely regulated by its extensive phosphorylation in the presence of insulin [4,5]. Tyrosine phosphorylation of IRS-1 at Tyr632 and Tyr896 activates insulin action, whereas serine phosphorylation at Ser302, Ser307, and Ser1101 generally attenuates it [4,5]. In accordance with glucose production, telmisartan dose-dependently increased p-IRS-1-Ser302 and decreased p-IRS-1-Tyr632 with no alterations in other phosphorylation sites of IRS-1, when HepG2 cells were stimulated by insulin (Fig. 1C, Supplementary Fig. 3). Furthermore, the phosphorylation of both sites was rarely detected in the absence of insulin (Fig. 1D). These results suggest that telmisartan impaired insulin action by altering IRS-1 phosphorylation in hyperglycemic HepG2 cells.
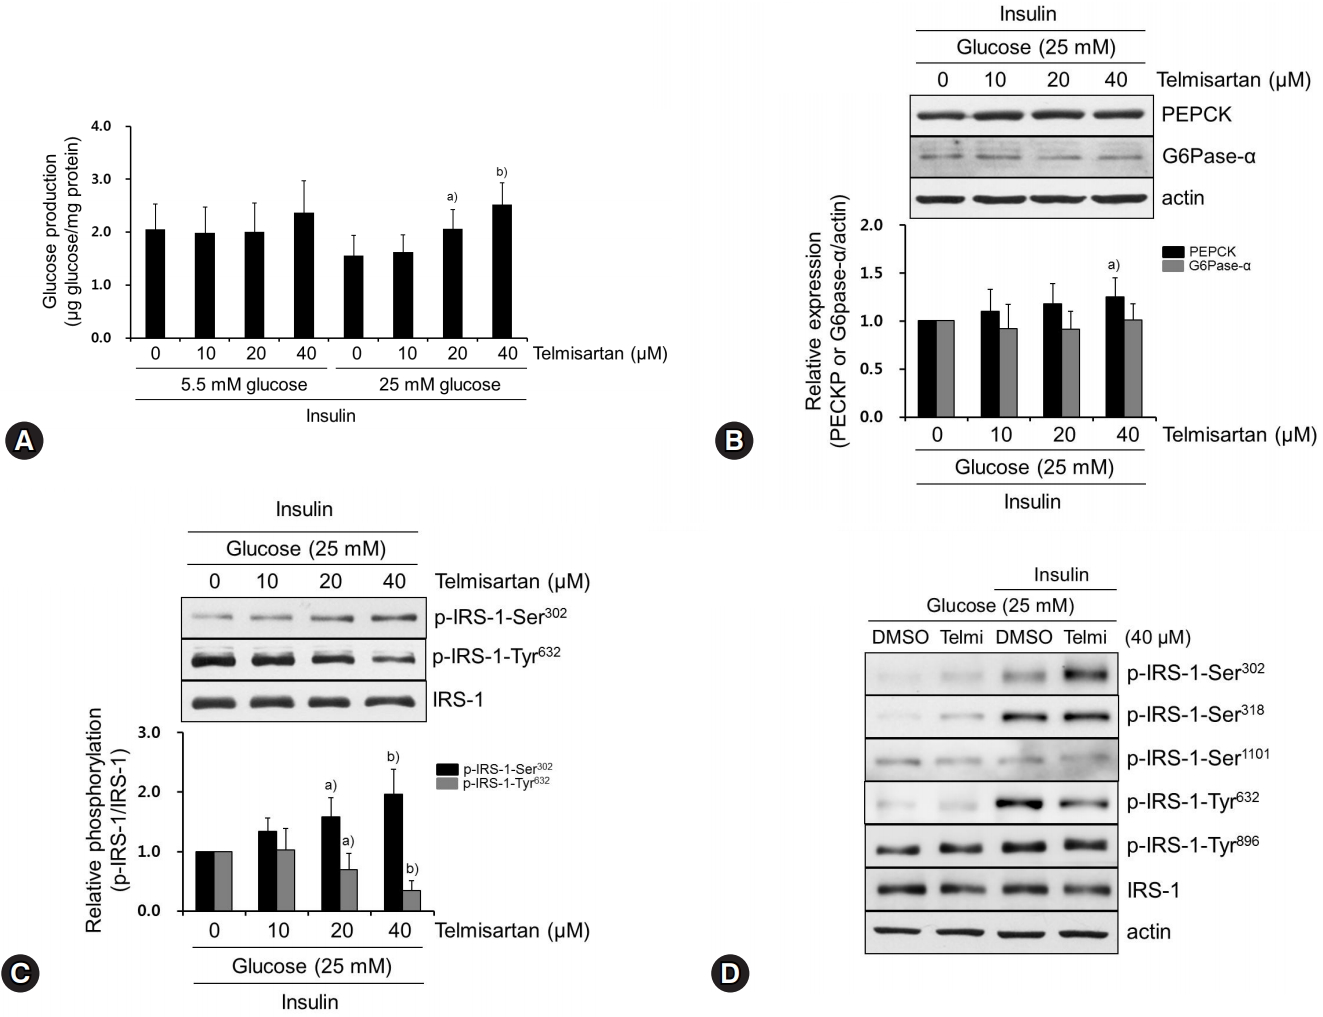
Telmisartan increases glucose production by increasing p-IRS-1-Ser302 and decreasing p-IRS-1-Tyr632 in hyperglycemic HepG2 cells. (A) HepG2 cells were treated with various doses of telmisartan (0, 10, 20, or 40 μM) for 24 h in the presence of 5.5 mM or 25 mM D-glucose and then glucose production assay was performed as described in the Methods. (B−D) HepG2 cells were treated with various doses of telmisartan (0, 10, 20, or 40 μM) for 24 h in the presence of 25 mM D-glucose and then with or without 100 nM insulin for an additional 10 min. Total proteins were obtained, and levels of PEPCK, G6Pase-α, p-IRS-1-Ser302, p-IRS-1-Ser318, p-IRS1-Ser1101, p-IRS-Tyr632, and p-IRS-Tyr896 were detected using western blot analysis. Nitrocellulose membranes were reprobed using antibody to detect actin or total IRS-1 to monitor equal sample loading. Densitometry was used to quantify PEPCK, G6Pase-α, p-IRS-1-Ser302, and p-IRS-Tyr632 relative to the actin or the IRS-1 bands, respectively. Blots represent at least four experiments. Bar graphs show mean fold alterations above/below control (±SD). Differences were statistically significant at a)p<0.05, b)p<0.01. IRS-1, insulin receptor substrate-1; PEPCK, phosphoenolpyruvate carboxykinase; G6Pase-α, glucose-6-phosphatase α.
2. Telmisartan-induced p-PKCζ-Thr410 mediates IRS-1 phosphorylation changes that increase glucose production
Among various upstream kinases for IRS-1 phosphorylation, we investigated whether telmisartan affects the expression and phosphorylation of PKCζ. This is because PKCζ acts as a negative feedback regulator in insulin-stimulated Fao cells and NIH-3T3 fibroblasts by decreasing tyrosine phosphorylation of IRS-1, which is secondarily caused by PKCζ-induced serine phosphorylation of IRS-1 [7,19,20]. As shown in Fig. 2A, telmisartan dose-dependently enhanced p-PKCζ-Thr410 without altering its expression. This result supports that telmisartan increased PKCζ activity because increased phosphorylation of PKCζ at Thr410 residue located in the PKCζ activation loop is well established to fully activate its enzymatic activity [21]. To clarify the role of PKCζ activation by telmisartan in IRS-1 phosphorylation and glucose production, we overexpressed dn-PKCζ constructs in HepG2 cells. As shown in Figs. 2B and 2C, ectopic expression of dn-PKCζ almost completely restored both the telmisartan-induced p-IRS-1-Ser302 and -repressed p-IRS-1-Tyr632, and the telmisartan-induced glucose production. These results clearly demonstrate that increased PKCζ activity mediated the effects of telmisartan on IRS-1 phosphorylation and glucose production in insulin-stimulated HepG2 cells. As expected, the minimal increase in PEPCK expression induced by telmisartan was not changed by overexpression of dn-PKCζ constructs (Fig. 2D), indicating that PEPCK expression did not affect glucose production.
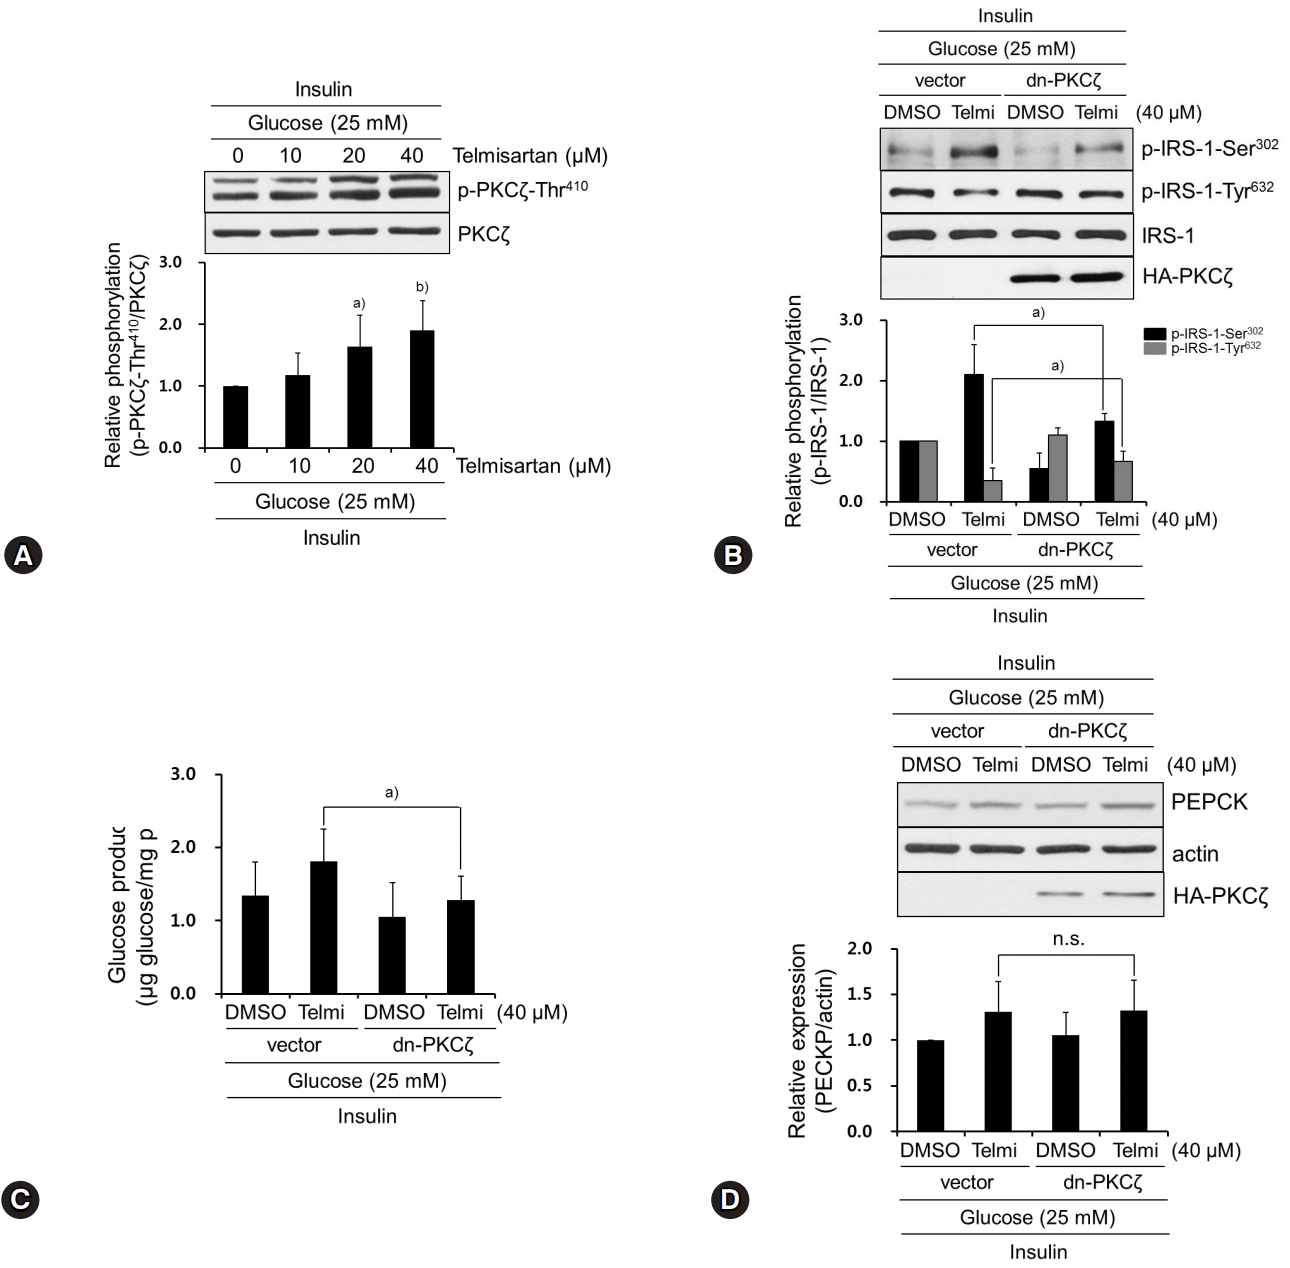
Telmisartan-induced p-PKCζ-Thr410 mediates IRS-1 phosphorylation changes that increase glucose production. (A) HepG2 cells were treated with various concentrations of telmisartan (0, 10, 20, or 40 μM) for 24 h in the presence of 25 mM D-glucose and then 100 nM insulin for an additional 10 min. Western blot analyses were performed as described in Fig. 1. (B) After HA-tagged dn-PKCζ (K281R) constructs were transfected into HepG2 cells as described in the Methods, cells were treated with 40 μM telmisartan or vehicle for 24 h in the presence of 25 mM D-glucose and then 100 nM for an additional 10 min. Western blot analyses were performed as described in Fig. 1. (C) HepG2 cells were transfected with dn-PKCζ constructs, treated with 40 μM telmisartan for 24 h in the presence of 25 mM D-glucose, and glucose production assay was performed as described in the Methods. (D) After transfection as described above, HepG2 cells were treated with 40 μM telmisartan for 24 h in the presence of 25 mM D-glucose and then 100 nM insulin for an additional 10 min. Western blot analyses were performed as described in Fig. 1. Blots represent at least four experiments. Bar graphs show mean fold alterations above/below control (±SD). Differences are statistically significant at a)p<0.05, b)p<0.01. n.s., not significant. PKCζ, protein kinase C ζ; IRS-1, insulin receptor substrate-1; HA, hemagglutinin.
3. Among tested ARBs, only telmisartan induces p-IRS-1-Ser302 and represses p-IRS-1-Tyr632 via PPARγ-independent pathway
We demonstrated that telmisartan increased glucose production in hyperglycemic HepG2 cells by increasing p-IRS-1-Ser302 and decreasing p-IRS-1-Tyr632 thereby attenuating insulin action. Although most ARBs share some structural moieties, each ARB contains highly variable side chains [9]. This paradigm led us to examine whether ARBs other than telmisartan also change IRS-1 phosphorylation. As shown in Fig. 3A, among the ARBs tested, including losartan and fimasartan, only telmisartan increased p-IRS-1-Ser302 and decreased p-IRS-1-Tyr632, indicating that its inhibitory effects on insulin action are specific properties. Unlike other ARBs, telmisartan is also reported to act as a PPARγ partial agonist [9]. To investigate the role of PPARγ in the telmisartan-altered IRS-1 phosphorylation, we performed inhibitor studies using GW9662, a specific and irreversible PPARγ antagonist [22]. As shown in Fig. 3B, GW9662 did not affect telmisartan-regulated IRS-1 phosphorylation. Taken together, our results suggest that telmisartan exerts its effects on IRS-1 phosphorylation in a PPARγ-independent manner.
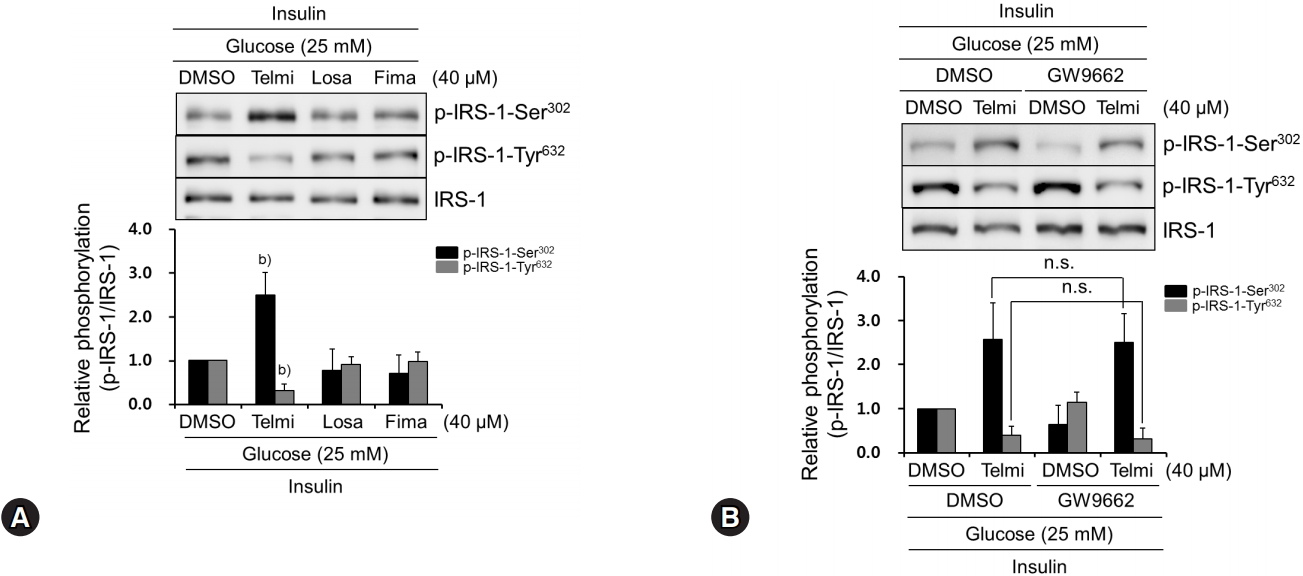
Among tested ARBs, only telmisartan induces p-IRS-1-Ser302 and represses p-IRS-1-Tyr632 via PPARγ-independent pathway. (A) HepG2 cells were treated with various ARBs (telmisartan, losartan, or fimasartan at 40 μM) for 24 h in the presence of 25 mM D-glucose and then 100 nM insulin for further 10 min. Western blot analyses were performed as described in Fig. 1. (B) After pretreatment with 5 μM GW9662 for 1 h, HepG2 cells were treated with 40 μM telmisartan for 24 h in the presence of 25 mM D-glucose and then 100 nM insulin for further 10 min. Western blot analyses were performed as described in Fig. 1. Blots represent at least four experiments. Bar graphs show mean fold alterations above/below control (±SD). Differences were statistically significant at b)p<0.01. n.s., not significant. ARB, angiotensin II type 1 receptor blocker; IRS-1, insulin receptor substrate-1; PPARγ, peroxisome proliferator-activated receptor γ.
4. Telmisartan induces p-IRS-1-Ser302, represses p-IRS-1-Tyr632, and increases p-PKCζ-Thr410 in livers of HFD-fed mice
Next, to confirm our in vitro findings in vivo, we performed animal studies by feeding mice with an HFD (60% fat kcal) for 13 weeks (Fig. 4A). In accordance with the in vitro results, the livers from telmisartan-treated mice showed significantly higher p-IRS-1-Ser302 and lower p-IRS-1-Tyr632 levels than those from vehicle-treated mice did (Fig. 4B), when insulin was injected through the portal vein. Furthermore, telmisartan treatment increased p-PKCζ-Thr410 by ~2.2-fold compared to that in vehicle-treated mice (Fig. 4C). Similar to the in vitro results, PEPCK and G6Pase-α expression levels were slightly increased in telmisartan-treated livers (Fig. 4D). However, telmisartan did not change Glut4 and Glut2 expression levels in the livers (Supplementary Fig. 4). These results revealed that the effects of telmisartan on phosphorylation of IRS-1 and PKCζ were also evident in vivo.
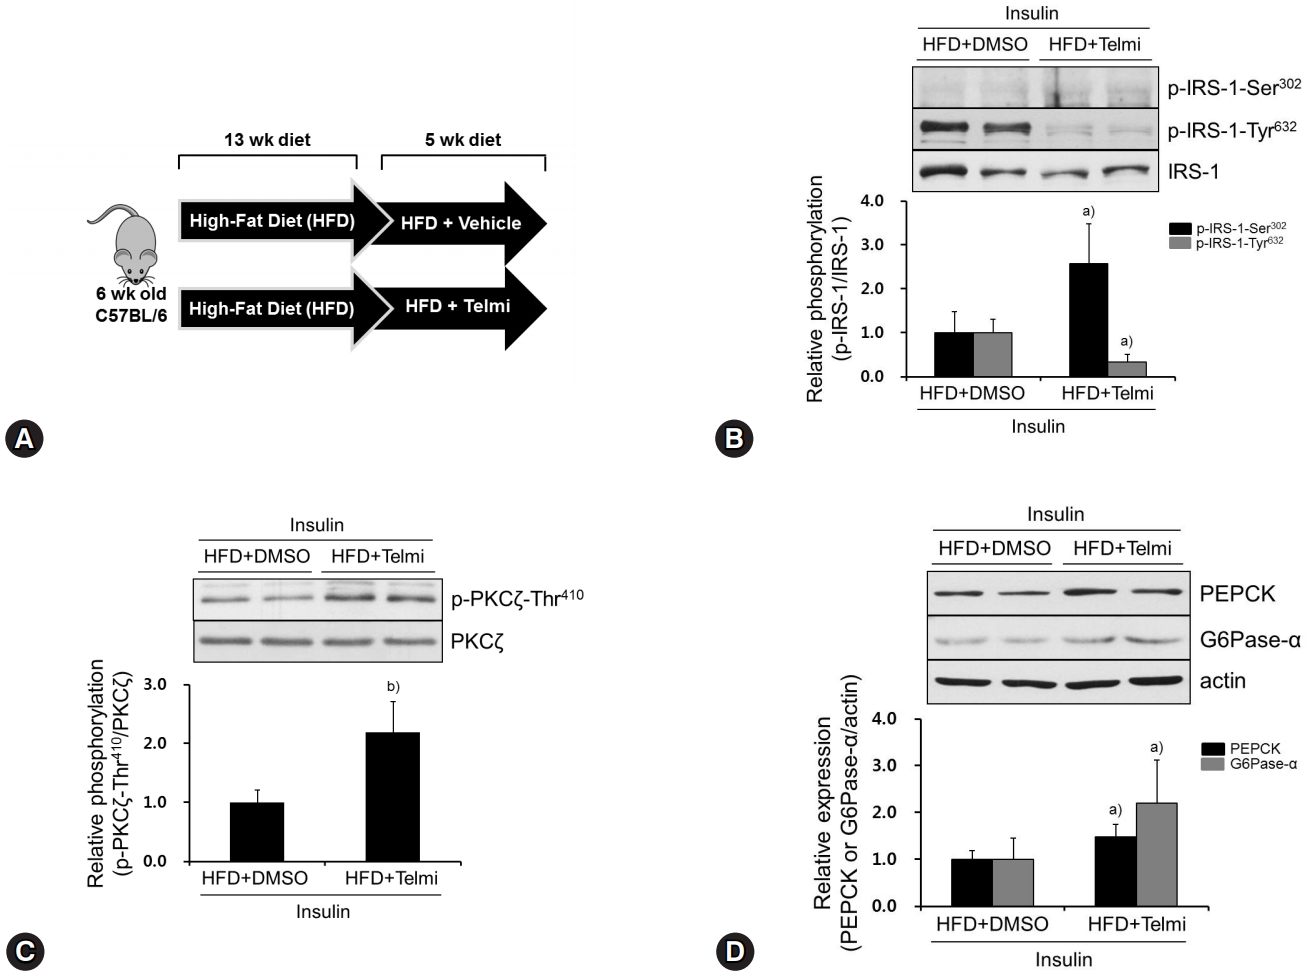
Telmisartan induces p-IRS-1-Ser302, represses p-IRS-1-Tyr632, and increases p-PKCζ-Thr410 in livers of HFD-fed mice. (A) Schematic diagram of animal experiments. Hyperglycemic mouse models were established as described in the Methods. (B‒D) Mice were euthanized, their livers were dissected, total liver proteins were extracted, and then subjected to western blot analysis as described in Fig. 1. Blots represent at least five livers from each mouse group. Bar graphs show mean fold alterations above/below control (±SD). Differences are statistically significant at a)p<0.05, b)p<0.01. IRS-1, insulin receptor substrate-1; PKCζ, protein kinase C ζ; HFD, high-fat diet.
Discussion
One of the most important findings in this study is that telmisartan impaired insulin action in hyperglycemic hepatocytes by increasing p-IRS-1-Ser302 and decreasing p-IRS-1-Tyr632, and consequently increased HGP (Figs. 1, 4). Although the effect of telmisartan on HGP has not been reported, several clinical trials reported that telmisartan reduces incidence of new-onset diabetes despite the different magnitude of the effects between trials [23]. A recent meta-analysis data revealed that telmisartan improves insulin resistance in patients with hypertension [10]. It was also reported that telmisartan has beneficial effects on insulin resistance in skeletal muscles and adipose tissues [12,13]. Based on the previous reports, therefore, our results suggest that the beneficial effects of telmisartan on glycemic control may be mediated by its actions on other insulin target organs such as the skeletal muscles and adipose tissues rather than the liver.
In the present study, we found that telmisartan increased HGP in hyperglycemic HepG2 cells (Fig. 1A) and, therefore, we expected that telmisartan may decrease p-Akt-Ser473 and p-GSK3β-Ser9, because Akt and GSK3β have been established as important mediators of insulin action and are used as markers for insulin resistance in vitro when the phosphorylation is suppressed [18]. However, our results revealed that telmisartan clearly enhanced p-Akt-Ser473 and p-GSK3β-Ser9 in hyperglycemic HepG2 cells, when insulin was present (Supplementary Fig. 2). Presently, we cannot fully explain the mechanism by which telmisartan increased HGP, despite the increase of p-Akt-Ser473 and p-GSK3β-Ser9. In this regard, Akt2 plays a pivotal role in the maintenance of glucose homeostasis, whereas Akt1 is not essential for the regulation of glucose homeostasis and chronically regulates the transcription of gluconeogenic enzymes rather than that of acute glucose output in vivo [2,24,25]. Our results and those of the previous reports suggest that telmisartan may exert its effects on HGP via a signaling pathway mediated by other signaling molecules rather than Akt1.
Although most ARBs share some structural moieties, each ARB contains highly variable side chains [9]. In terms of structural chemistry, unlike other ARBs, telmisartan contains a carboxyl group substituted for the common tetrazole group linked to the biphenyl moiety, and two benzimidazole groups that are linked tandemly [9]. Thus, telmisartan may have various ancillary effects along with its common blood pressure-lowering effects. For example, telmisartan is reported to ameliorate vascular inflammation [26,27] and to act as a PPARγ partial agonist [9]. Obermoser et al. have recently reported that the biphenyl moiety and the centered benzimidazole group directly linked to the biphenyl moiety are critical for PPARγ activation [28]. We also found that among the ARBs tested, only telmisartan increased p-IRS-1-Ser302 and decreased p-IRS-1-Tyr632 in a PPARγ-independent manner (Fig. 3). Based on the report and our findings, we speculate that the distinctive inhibitory effects of telmisartan are attributable to its structural differences from other ARBs, and especially the second benzimidazole moiety linked to the centered one may play an important role in mediating the telmisartan’s effects. However, further studies, including assessment of ARBs not examined in our study, and medicinal chemistry analyses would be needed to clarify this point.
Previously, Moeschel et al. reported that the PKCζ-mediated phosphorylation of IRS-1 at Ser318 attenuates IRS-1 function in response to prolonged insulin stimulation [29]. However, other inhibitory serine residues that phosphorylated by PKCζ are not fully identified. Furthermore, effects of the PKCζ-inhibited IRS-1 activity on its downstream effectors including PI3K and Akt are rarely elucidated, although PKCζ has been reported to be able to initiate a negative feedback regulation in the insulin-stimulated cells by decreasing tyrosine phosphorylation of IRS-1, which is secondarily caused by PKCζ-induced serine phosphorylation of IRS-1 [7,19,20]. In this respect, Ravichandran et al. revealed that overexpression of wild-type PKCζ reduces the activity of PI3K which is associated IRS-1 without inhibition of total PI3K activity [20] and PKCζ-induced phosphorylation of IRS-1 specifically interferes with the phosphorylation of IRS-1 at Tyr612 and Tyr632 [20]. In accordance with the report, we showed that PKCζ activated by telmisartan attenuated insulin action in hyperglycemic hepatocytes by increasing p-IRS-1-Ser302 and decreasing p-IRS-1-Tyr632 (Figs. 2, 4). Therefore, our results suggest that the PKCζ-mediated phosphorylation of IRS-1 at Ser302 plays an important role in the negative feedback regulation of IRS-1 activity. In addition, we also found that telmisartan elevated p-Akt-Ser473 that is considered as an important downstream effector of IRS-1 and PI3K which mediate insulin signaling (Supplementary Fig. 2). Based on the report and our results, we speculate that telmisartan augmented a negative feedback signaling pathway through PKCζ activation. Following insulin treatment, PI3K is activated and phosphorylates its downstream effectors including phosphoinositide-dependent protein kinase-1 (PDK-1) by which PDK-1 is activated and phosphorylates Akt1 and PKCζ. Telmisartan may have promoted PDK-1-mediated PKCζ phosphorylation and activated PKCζ increases p-IRS-1-Ser302, which reduces p-IRS-1-Tyr632. This process finally attenuates the activity of IRS-1, although activated PDK-1 could still phosphorylate Akt1, elevating p-Akt-Ser473. In support of this notion, PDK-1 is the best known upstream kinase for Akt1 phosphorylation, and our results showed that telmisartan increased p-Akt-Ser473 (Supplementary Fig. 2), and a previous study also reported that PDK-1 phosphorylates PKCζ at threonine 410 and activates it [21].
Previously, high interpatient variability in telmisartan plasma concentrations has been reported in patients with mild to moderate hypertension; mean +/- SD values for Cmax are 159 +/- 104 ng/mL for telmisartan 40 mg, 693 +/- 606 ng/mL for telmisartan 80 mg, and 1635 +/- 1406 ng/mL for telmisartan 120 mg, which are equivalent to 0.31 +/- 0.20 μM for telmisartan 40 mg, 1.35 +/- 1.12 μM for telmisartan 80 mg, and 3.12 +/- 2.73 μM for telmisartan 120 mg, respectively [30]. Similarly, Zhang et al. have also reported that mean +/- SD values for Cmax in healthy Chinese subjects are 163.2 +/- 128.4 ng/mL and 905.7 +/- 583.4 ng/mL for 40 mg and 80 mg telmisartan, which are equivalent to 0.32 +/- 0.25 μM and 1.76 +/- 1.13 μM for 40 mg and 80 mg telmisartan, respectively [31]. If telmisartan concentrations used in our in vitro experiments (10–40 μM) are simply compared to these clinical data, these seem to be higher. However, we clearly showed that telmisartan exerted its effects on HGP, p-IRS-1-Ser302, p-IRS-1-Tyr632, and p-PKCζ-Thr410 at 20 μM telmisartan, although profound effects were exhibited at 40 μM telmisartan (Figs. 1A, 1C, 2A). In addition, higher concentration of telmisartan at 100 μM has been used in other in vitro investigations [32,33]. With taking account of our results and other in vitro experiments using telmisartan, concentration of telmisartan used in the present study is considered fairly compatible with a clinically observed peak Cmax.
In conclusion, we demonstrate that telmisartan increases HGP by inducing p-PKCζ-Thr410, which increases p-IRS-1-Ser302 and decreases p-IRS-1-Tyr632 in a PPARγ-independent manner. These actions consequently impair the action of insulin in hyperglycemic HepG2 cells and HFD-fed mouse livers. These results suggest that the beneficial effects of telmisartan on insulin resistance and cardiometabolic profile [10,11] may be mediated by its actions on other insulin target organs such as the skeletal muscles and adipose tissues rather than the liver.
Supplementary Materials
Supplementary materials related to this article can be found online at https://doi.org/10.12701/yujm.2019.00059
Telmisartan decreases glucose uptake and Glut4 expression in hyperglycemic HepG2 cells. (A) After HepG2 cells were serum starved overnight, cells were treated with various doses of telmisartan (0, 10, 20, or 40 μM) for 24 h in the presence of 25 mM D-glucose and then glucose uptake assay was performed as described in the Methods. (B) HepG2 cells were treated with various doses of telmisartan (0, 10, 20, or 40 μM) for 24 h in the presence of 25 mM D-glucose and then with 100 nM insulin for further 10 min. Western blot analyses were performed as described in Fig. 1. Blots represent at least four experiments. Bar graphs show mean fold alterations above/below control (±SD). Differences were statistically significant at a)p<0.05.
Telmisartan increases p-Akt-Ser473 and p-GSK3β-Ser9 in hyperglycemic HepG2 cells. HepG2 cells were treated with various doses of telmisartan (0, 10, 20, or 40 M) for 24 h in the presence of 25 mM D-glucose and then with 100 nM insulin for further 10 min. Western blot analyses were performed as described in Fig. 1. Blots represent at least four experiments. Bar graphs show mean fold alterations above/below control (±SD). Differences were statistically significant at a)p<0.05, b)p<0.01. GSK3β, glycogen synthase kinase-3β.
Telmisartan does not alter p-IRS-1-Ser318, p-IRS-1-Ser1101, and p-IRS-1-Tyr896 in hyperglycemic HepG2 cells. HepG2 cells were treated with various doses of telmisartan (0, 10, 20, or 40 μM) for 24 h in the presence of 25 mM D-glucose and then with 100 nM insulin for further 10 min. Western blot analyses were performed as described in Fig. 1. Blots represent at least four experiments. Bar graphs show mean fold alterations above/below control (±SD). IRS-1, insulin receptor substrate-1.
Telmisartan does not change Glut4 and Glut2 expression in livers of HFD-fed mice. Mice were euthanized, their livers were dissected, total liver proteins were extracted, and then subjected to western blot analysis as described in Fig. 1. Blots represent at least five livers from each mouse group. Bar graphs show mean fold alterations above/below control (±SD). HFD, high-fat diet.
Acknowledgements
This work was supported by the National Research Foundation of Korea (NRF) grant funded by the Korea government (2015R1D1A1A01058499).
Notes
All authors declare that no conflict of interest exists.