 E-Submission
PubMed Central, CAS, DOAJ, KCI

Articles
- Page Path
- HOME > J Yeungnam Med Sci > Volume 39(4); 2022 > Article
-
Original article
Clinical impact of spine magnetic resonance imaging as a valuable prognostic tool for patients with multiple myeloma: a retrospective study -
Jung Min Lee1
 , Hee Jeong Cho1, Joon-Ho Moon1, Sang Kyun Sohn1, Byunggeon Park2, Dong Won Baek1
 -
Journal of Yeungnam Medical Science 2022;39(4):300-308.
DOI: https://doi.org/10.12701/jyms.2021.01648
Published online: March 23, 2022
1Department of Hematology-Oncology, Kyungpook National University Hospital, School of Medicine, Kyungpook National University, Daegu, Korea
2Department of Radiology, Kyungpook National University Hospital, School of Medicine, Kyungpook National University, Daegu, Korea
- Corresponding author: Dong Won Baek, MD, PhD Department of Hematology/Oncology, Kyungpook National University Hospital, School of Medicine, Kyungpook National University, 130 Dongdeok-ro, Jung-gu, Daegu 41944, Korea Tel: +82-53-200-5568 • Fax: +82-53-426-2046 • E-mail: baekdw83@gmail.com
Copyright © 2022 Yeungnam University College of Medicine, Yeungnam University Institute of Medical Science
This is an Open Access article distributed under the terms of the Creative Commons Attribution Non-Commercial License (http://creativecommons.org/licenses/by-nc/4.0/) which permits unrestricted non-commercial use, distribution, and reproduction in any medium, provided the original work is properly cited.
Abstract
-
Background
- This study investigated the prognostic impact of spine magnetic resonance imaging (MRI) in patients newly diagnosed with multiple myeloma (MM).
-
Methods
- We retrospectively evaluated 214 patients who were newly diagnosed with MM between March 2015 and December 2019. The patients were classified into five different infiltration patterns based on spine MRI as follows: (1) normal appearance, (2) focal, (3) diffuse, (4) combined focal and diffuse infiltration, and (5) “salt-and-pepper.”
-
Results
- Forty patients (18.7%) showed a normal appearance, whereas focal, diffuse, combined focal and diffuse infiltration, and “salt-and-pepper” patterns were identified in 68 (31.8%), 40 (18.7%), 52 (24.3%), and 14 patients (6.5%), respectively. The patients with normal and “salt-and-pepper” patterns were younger than patients with other patterns (median age, 61.6 vs. 66.8 years; p=0.001). Moreover, 63% and 59.3% of patients with normal and “salt-and-pepper” patterns were scored International Staging System (ISS) stage I and revised ISS (R-ISS) stage I, respectively, whereas only 12.5% of patients with other patterns were scored ISS stage I and R-ISS stage I. Patients with normal and “salt-and-pepper” patterns had a better prognosis than those with other patterns, whereas relapse and death rates were significantly higher in patients with focal, diffuse, and combined MRI patterns.
-
Conclusion
- Characteristic MRI findings have a significant prognostic value for long-term survival in patients newly diagnosed with MM. In particular, focal, diffuse, and combined focal and diffuse infiltration patterns are unfavorable prognostic factors.
- Multiple myeloma (MM) is a neoplastic plasma cell disorder that accounts for approximately 10% of hematologic malignancies [1]. The introduction of various agents and autologous stem-cell transplantation (ASCT) has improved survival; however, MM is still considered an incurable disease [2,3]. Moreover, patients newly diagnosed with MM might show a heterogeneous prognosis, with survival durations ranging from a few months to more than 10 years [4,5]. Previous studies have attempted to establish a reliable prognostic system based on various factors such as staging and disease-related biology. The International Staging System (ISS) and revised ISS (R-ISS) are representative clinically useful prognostic scoring systems based on serum albumin, beta-2 microglobulin (B2M), and serum lactate dehydrogenase (LDH) levels, as well as high-risk chromosomal abnormalities detected by fluorescence in situ hybridization (FISH) [6,7]. However, these prognostic models still have some pitfalls in that there is no interlaboratory standardization of FISH analysis and cutoff levels for LDH. In addition, a relatively short median follow-up period and exclusion of host-related factors are possible limitations [7].
- Magnetic resonance imaging (MRI) is highly sensitive for the detection of focal bone or bone marrow lesions, including those that are not osteolytic. Therefore, the revised International Myeloma Working Group (IMWG) diagnostic criteria for MM include MRI [8]. MRI could predict disease progression in which patients with MM with more than one focal bone lesion had a higher risk of progression to end-organ damage [9-11]. Several studies have classified MRI findings and attempted to identify their clinical significance as a predictive or prognostic modality in patients newly diagnosed with MM [12,13]. Song et al. demonstrated that spine MRI at the time of diagnosis was useful for prognosis in a study of 113 patients [14]. However, the role of MRI in predicting the treatment response and deciding whether to proceed with ASCT remains controversial.
- Therefore, this study aimed to identify the novel prognostic role of spine MRI in patients newly diagnosed with MM. In addition, we analyzed the response to standard treatment and ASCT according to the specific patterns of spine MRI.
Introduction
- Ethical statements: This study was approved by the Institutional Review Board (IRB) of Kyungpook National University Hospital (IRB No: KNUH 2021-12-023) in accordance with the Declaration of Helsinki. The requirement for informed consent was waived by the IRB due to the use of anonymized data and the retrospective design.
- 1. Patients
- This study retrospectively reviewed 214 patients who were newly diagnosed with MM between January 2015 and December 2019 at KNUH. Patients were diagnosed with MM based on the revised IMWG criteria and underwent whole-spine MRI before the initiation of anti-myeloma treatment. MM-related work-up, including protein electrophoresis; levels of serum immunoglobulin, serum B2M, and LDH; and FISH was investigated, and ISS and R-ISS stages were evaluated. Patient records were reviewed for medical history, age, sex, laboratory test results, treatment method, response, and survival.
- 2. Spine magnetic resonance imaging
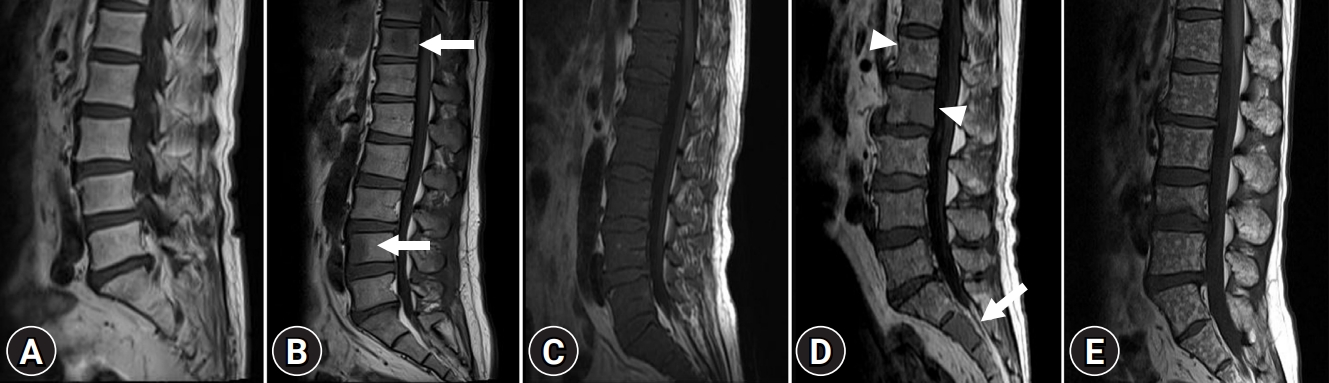
- Whole-spine MRI was performed to investigate bone marrow infiltration patterns and soft tissue masses, including sagittal and axial T1- and T2-weighted MRI images. Gadolinium-enhanced axial and sagittal T1-weighted MRI images were also obtained. All MRI images were analyzed by two radiologists. Based on previous data, patients were classified into five different infiltration patterns of spine MRI as follows: (1) normal appearance of bone marrow, (2) focal infiltration, (3) homogeneous diffuse infiltration, (4) combined focal and diffuse infiltration, and (5) “salt-and-pepper” pattern with inhomogeneous bone marrow and interposition of fat islands (Fig. 1) [15,16].
- 3. Statistical analyses
- Categorical variables are summarized as counts with proportions, and continuous variables are described as medians with ranges. Progression-free survival (PFS) was calculated from the time of treatment to the point of disease progression or death. Overall survival (OS) was measured from the time of diagnosis to death or the last follow-up date. The probabilities of PFS and OS were estimated using the Kaplan-Meier method and compared using the log-rank test. The Mantel-Byar test and the Simon and Makuch method were used to address the time-dependent covariate approach for ASCT. Cox regression was used to identify factors associated with long-term survival. Factors with a p-value of <0.1 in the univariate analysis were included in the multivariate analysis. The hazard ratio (HR) and 95% confidence interval (CI) were estimated for each factor. Statistical significance was set at p<0.05. Statistical analyses were conducted using R statistical software ver. 3.6.2 (R Foundation for Statistical Computing, Vienna, Austria; available at http://www.r-project.org).
Methods
- 1. Patient characteristics
- The median age at the time of diagnosis was 67 years (range, 37–87 years), and 88 patients (41.1%) were male. Forty patients (18.7%) showed normal bone marrow, while focal infiltration, diffuse infiltration, combined focal and diffuse infiltration, and “salt-and-pepper” patterns were identified in 68 (31.8%), 40 (18.7%), 52 (24.3%), and 14 patients (6.5%), respectively. Sixty-six patients (30.8%) were able to receive ASCT. Most patients underwent bortezomib-based chemotherapy as first-line treatment. The patient characteristics are summarized in Table 1.
- 2. Survival outcomes according to spine magnetic resonance imaging patterns
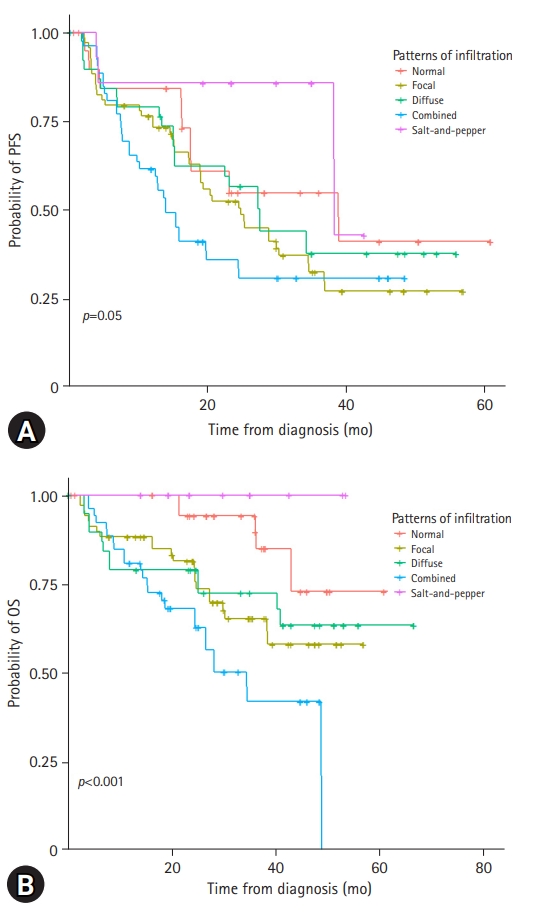
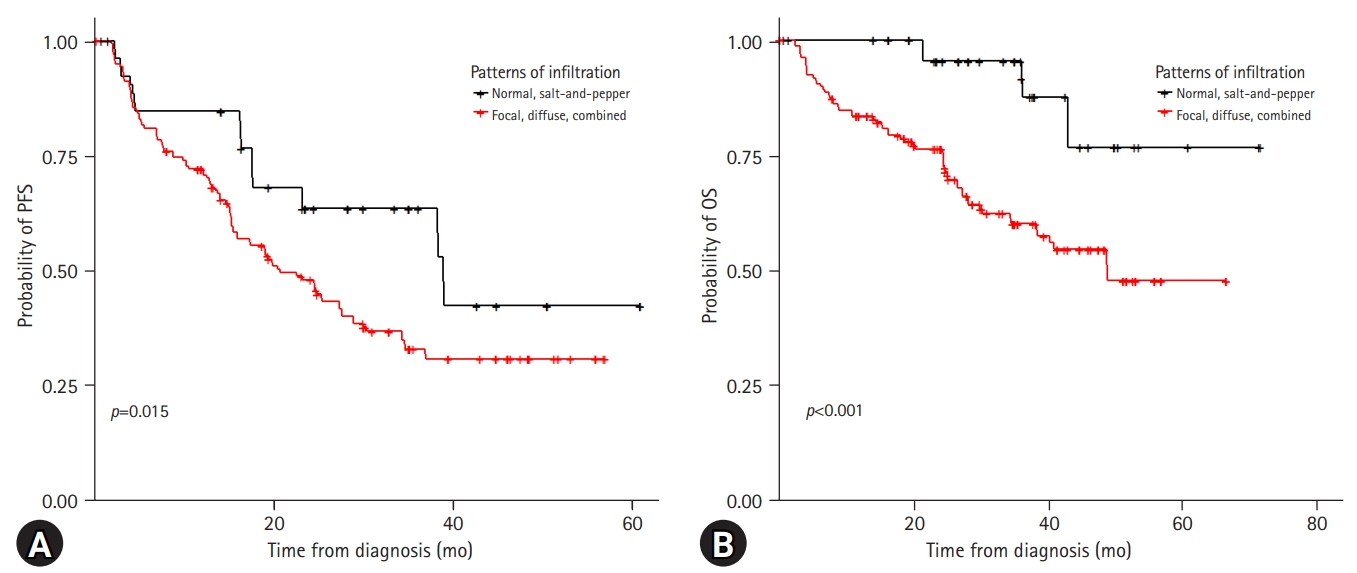
- With a median follow-up period of 37.9 months, the 3-year PFS and OS rates of the patients were 39.8% and 66.9%, respectively (Supplementary Fig. 1). Among the 214 patients, 98 (45.8%) experienced relapse and 66 (30.8%) died. The risk stratification of the enrolled patients was classified according to ISS and R-ISS (Supplementary Fig. 2). In the spine MRI-based subgroup analysis, the patients showed various clinical outcomes (Fig. 2). In particular, the patients with normal bone marrow and “salt-and-pepper” patterns had a relatively better prognosis than those with other patterns (Fig. 3). The patients with normal and “salt-and-pepper” MRI patterns tended to be younger than those with other patterns (median age, 61.6 vs. 66.8 years; p=0.001). Moreover, 63% and 59.3% of patients with normal and “salt-and-pepper” patterns were classed as ISS stage I and R-ISS stage I, respectively, whereas only 12.5% of patients with other patterns were classed as ISS stage I and R-ISS stage I. More patients with normal and “salt-and-pepper” MRI patterns could undergo ASCT. Relapse and death rates were significantly higher in patients with focal, diffuse, and combined MRI patterns than in those with other patterns (Table 2).
- 3. Relevance of autologous stem-cell transplantation with regard to spine magnetic resonance imaging patterns
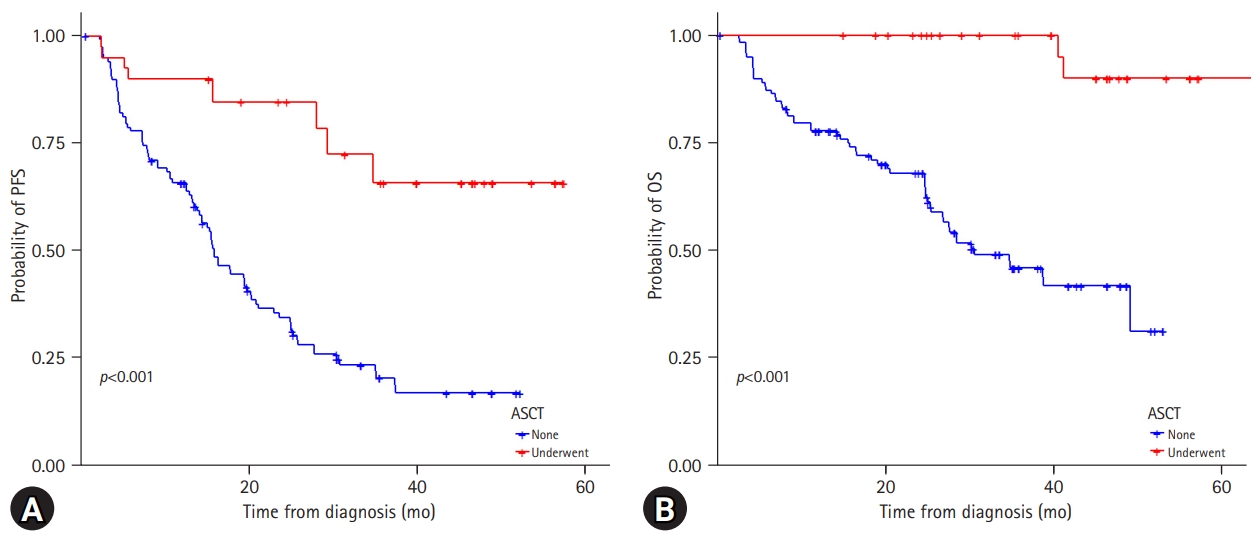
- Among the 214 patients, 66 (30.8%) underwent ASCT. In the normal and “salt-and-pepper” pattern groups, 48.1% of patients underwent ASCT, while 25.0% of patients with other patterns could receive transplantation (Table 2). Overall, the patients who underwent ASCT showed significantly better PFS and OS than those who did not (Supplementary Fig. 3). In the focal, diffuse, and combined infiltration groups, patients who received ASCT had superior PFS (p<0.001) and OS (p<0.001), while in the normal and “salt-and-pepper” patterns, patients who underwent ASCT only had better PFS (Fig. 4). Twelve patients experienced disease relapse after ASCT. Four patients (33.3%) showed normal bone marrow patterns, whereas eight patients (66.7%) showed focal and diffuse infiltration.
- 4. Independent prognostic factors affecting long-term outcomes
- Multivariate survival analysis for PFS revealed that elevated LDH levels and high-risk cytogenetics were significant poor prognostic factors (HR, 3.278; 95% CI, 1.601–3.546; p<0.001 and HR, 2.997; 95% CI, 1.281–3.262; p=0.003, respectively). ISS and R-ISS were correlated with disease progression (HR, 2.903; 95% CI, 1.976–4.135; p<0.001 and HR, 1.329; 95% CI, 1.013–4.493; p=0.032, respectively). In addition, focal, diffuse, and combined MRI patterns were significantly associated with lower PFS than normal and “salt-and-pepper” patterns (HR, 2.040; 95% CI, 1.372–3.032; p<0.001). In the multivariate analysis of OS, younger age (≤65 years), ISS I, and R-ISS I were significantly associated with better survival (younger age: HR, 1.595; 95% CI, 1.043–2.440; p=0.031; ISS I: HR, 4.253; 95% CI, 2.198–8.001; p<0.001; and R-ISS I: HR, 3.010; 95% CI, 1.429–7.712; p=0.002). Focal, diffuse, and combined MRI patterns were factors associated with poor prognosis in terms of OS (HR, 2.010; 95% CI, 1.216–3.322; p=0.006) (Table 3).
Results
- Osteolytic bone lesions are a hallmark of MM and key factors in the revised IMWG diagnostic criteria [8]. Up to 80% of patients present with bone lesions at the time of diagnosis, and patients with osteolytic bone lesions have an increased risk of skeleton-related events associated with high morbidity and mortality [17]. Myeloma-related bone disease occurs due to an unbalanced bone-remodeling process in which the interaction between myeloma cells and the bone microenvironment leads to the activation of osteoclasts and suppression of osteoblasts, resulting in bone loss [18]. Receptor activator of nuclear factor kappa-Β (RANK)/RANK ligand/osteoprotegerin, Notch, Wnt, and numerous chemokines and interleukins are implicated in these complex intracellular or intercellular signaling cascades [19,20]. However, little research has been conducted on the association between specific MRI patterns in patients with MM and clinical outcomes. In this study, we classified the spine MRI patterns of patients newly diagnosed with MM into five categories (normal, focal, diffuse, combined, and “salt-and-pepper” patterns) based on previous studies [9,21]. Some previous studies have already suggested that patients with focal and diffuse MRI patterns have inferior clinical outcomes compared with those with normal or “salt-and-pepper” patterns [13,22]. In the current study, the focal, diffuse, and combined patterns were significantly associated with older age, advanced disease status, and higher rates of relapse and death. Patients with normal and “salt-and-pepper” MRI patterns were younger, and the majority had a lower disease status in ISS and R-ISS staging.
- Generally, X-rays are used to detect bone lesions in patients with newly diagnosed MM. However, plain radiographs have several limitations such as poor quality visualization, low sensitivity, and observer-dependent analysis [23]. Computed tomography (CT) is one of the most commonly used tools for evaluating bone lesions and disease status, with high accuracy. Positron emission tomography and CT (PET-CT) scans are also crucial for the detection of bone lesions in the diagnosis of MM [24]. However, the superiority of clinical use of each modality remains controversial. MRI is regarded as the most sensitive tool for identifying the detailed bone marrow infiltration status [25]. Moreover, Baur-Melnyk et al. [26] demonstrated that whole-body multidetector CT showed a significantly lower detection rate and staging than MRI in patients with MM. In addition, the disease status of MM is mainly based on scoring staging systems such as ISS and R-ISS. The presence of the cytogenetic abnormalities t(4;14), t(14;16), del17p, and add1q21 are known to be associated with poor outcomes [13,22]. Several studies have also suggested an association between cytogenetic abnormalities and MRI patterns of marrow infiltration. Moulopoulos et al. [27] reported that diffused MRI patterns showed a higher incidence of high-risk cytogenetic features, including del17p, add1q21, and del13q, than focal or normal MRI patterns. Moreover, patients with diffuse MRI patterns have adverse myeloma features and increased microvessel density in their trephine biopsies [12]. These results are in accordance with the findings of Hillengass et al. [28], where the presence of 1q21, del17p, and del13q significantly correlated with at least one abnormal finding in bone marrow dynamic contrast-enhanced MRI. In addition, these chromosomal abnormalities can trigger an angiogenic cascade in MM.
- High-dose chemotherapy with hematopoietic stem-cell rescue remains the standard of care for transplant-eligible MM patients [29,30]. ASCT is associated with significantly improved PFS and OS [30,31]. However, some cases of recurrence of MM after ASCT have been found in young and low-risk patients in current clinical practice. In contrast, some older patients with high ISS and R-ISS stages who had not undergone ASCT were cured without relapse. Considering transplantation-related mortalities and emerging effective novel agents, performing ASCT in all transplant-eligible patients may not be appropriate. However, the eligibility for ASCT was evaluated through a risk-benefit assessment, including age, comorbidities, and general condition. There are no impactive international guidelines for assessing the progress of ASCT. Imaging can visually provide identifiable information in patients with malignant disease, such as interim PET-CT in malignant lymphoma, and this can change the paradigm of the treatment strategy. Therefore, further research on spine MRI in MM patients should be performed, including interim MRI, regular follow-up MRI, and MRI at the time of diagnosis, to identify the role of MRI as a key factor for establishing a treatment strategy, such as ASCT.
- While the present study showed promising results of spine MRI to predict outcomes in newly diagnosed patients, our data should be interpreted cautiously due to certain limitations. First, spine MRI was mainly evaluated rather than whole-body imaging in this study. Second, we could not compare other imaging modalities to MRI in the current analysis. Finally, this study included a diverse patient population and was retrospectively analyzed.
- In conclusion, the focal, diffuse, and combined patterns of patients newly diagnosed with MM were significantly associated with older age, advanced disease status, and higher rates of relapse and death, whereas patients with normal and “salt-and-pepper” patterns showed relatively better clinical outcomes. Although data on follow-up MRI and its clinical significance have not been evaluated, spine MRI can play a role in assessing treatment responses. Performing follow-up spine MRI may help clinicians clarify treatment responses and reestablish appropriate treatment plans.
Discussion
Supplementary materials
Fig. S1.
Fig. S2.
Fig. S3.
-
Conflicts of interest
No potential conflict of interest relevant to this article was reported.
-
Funding
None.
-
Author contributions
Conceptualization: all authors; Investigation: JML, HJC, JHM, BP, DWB; Data curation: DWB; Formal analysis: JML, HJC, JHM, SKS, DWB; Methodology: JHM, BP, DWB; Visualization: BP, DWB; Supervision: JHM, SKS, DWB; Writing-original draft: JML, SKS, BP, DWB; Writing-review & editing: HJC, JHM, SKS, DWB.
Notes
| Characteristic | Data |
|---|---|
| No. of patients | 214 |
| Age (yr) | 67 (37–87) |
| >70 | 70 (32.7) |
| Sex | |
| Male | 88 (41.1) |
| Female | 126 (58.9) |
| Elevated LDH | 48 (22.4) |
| Serum creatinine, >2 mg/dL | 40 (18.7) |
| BM plasma cell (%) | |
| <60 | 186 (86.9) |
| ≥60 | 28 (13.1) |
| Extramdeullary plasmacytoma | 17 (7.9) |
| High-risk CA by iFISHa) | 31 (14.5) |
| ISS | |
| I | 54 (25.2) |
| II | 62 (29.0) |
| III | 98 (45.8) |
| R-ISS | |
| I | 52 (24.3) |
| II | 90 (42.1) |
| III | 58 (27.1) |
| Unknown | 14 (6.5) |
| BM involvement patterns | |
| Normal | 40 (18.7) |
| Focal infiltration | 68 (31.8) |
| Diffuse infiltration | 40 (18.7) |
| Combined focal and diffuse infiltration | 52 (24.3) |
| Salt-and-pepper | 14 (6.5) |
| First-line treatment | |
| VTD | 127 (59.3) |
| VMP | 65 (30.4) |
| Others | 22 (10.3) |
| ASCT | 66 (30.8) |
| Relapse | 98 (45.8) |
| Death | 66 (30.8) |
Values are presented as number only, median (range), or number (%).
LDH, lactate dehydrogenase; BM, bone marrow; CA, chromosomal abnormalities; iFISH, interphase fluorescence in situ hybridization; ISS, International Staging System; R-ISS, revised International Staging System; VTD, bortezomib, thalidomide, and dexamethasone; VMP, bortezomib, melphalan, and prednisone; ASCT, autologous stem-cell transplantation.
a) High-risk cytogenetics: t(4;14), t(14;16), or del(17q).
| Variable |
Progression-free survival |
Overall survival |
||||||
|---|---|---|---|---|---|---|---|---|
|
Univariate |
Multivariate |
Univariate |
Multivariate |
|||||
| HR (95% CI) | p-value | HR (95% CI) | p-value | HR (95% CI) | p-value | HR (95% CI) | p-value | |
| Age (yr), >65 vs. ≤65 | 1.232 (0.814–1.863) | 0.325 | 1.566 (1.021–2.403) | 0.039 | 1.195 (1.012–3.659) | 0.045 | ||
| Sex, male vs. female | 0.993 (0.666–1.480) | 0.973 | 0.954 (0.585–1.678) | 0.851 | ||||
| LDH, elevated vs. normal | 2.310 (1.090–2.870) | 0.001 | 3.278 (1.601–3.546) | <0.001 | 3.224 (1.383–3.786) | 0.001 | 3.690 (1.469–3.509) | <0.001 |
| Serum Cr (mg/dL), ≥2 vs.<2 | 1.751 (0.753–2.890) | 0.452 | 1.127 (0.814–2.140) | 0.259 | ||||
| BM plasma cell, ≥60% vs.<60% | 1.805 (0.251–3.152) | 0.421 | 0.694 (0.223–2.043) | 0.487 | ||||
| EM plasmacytoma, yes vs. none | 0.463 (0.251–2.352) | 0.643 | 0.733 (0.451–5.744) | 0.464 | ||||
| High-risk cytogeneticsa), yes vs. none | 3.089 (1.277–2.986) | 0.002 | 2.997 (1.281–3.262) | 0.003 | 3.797 (1.493–3.510) | <0.001 | 3.791 (1.781–3.961) | <0.001 |
| ISS, II & III vs. I | 3.017 (1.573–5.728) | <0.001 | 2.903 (1.976–4.135) | <0.001 | 4.278 (2.156–8.292) | <0.001 | 4.253 (2.198–8.001) | <0.001 |
| R-ISS, II & III vs. I | 2.058 (1.141–4.392) | 0.002 | 1.329 (1.013–4.493) | 0.032 | 3.647 (1.979–7.345) | 0.001 | 3.010 (1.429–7.712) | 0.002 |
| Focal, diffuse, combined vs. normal, “salt-and-pepper” | 1.954 (1.297–2.944) | 0.001 | 2.176 (1.118–3.962) | <0.001 | 2.076 (1.248–3.453) | 0.004 | 2.010 (1.216–3.322) | 0.006 |
- 1. Siegel RL, Miller KD, Jemal A. Cancer statistics, 2020. CA Cancer J Clin 2020;70:7–30.ArticlePubMed
- 2. Cavo M, Tacchetti P, Patriarca F, Petrucci MT, Pantani L, Galli M, et al. Bortezomib with thalidomide plus dexamethasone compared with thalidomide plus dexamethasone as induction therapy before, and consolidation therapy after, double autologous stem-cell transplantation in newly diagnosed multiple myeloma: a randomised phase 3 study. Lancet 2010;376:2075–85.ArticlePubMed
- 3. Richardson PG, Weller E, Lonial S, Jakubowiak AJ, Jagannath S, Raje NS, et al. Lenalidomide, bortezomib, and dexamethasone combination therapy in patients with newly diagnosed multiple myeloma. Blood 2010;116:679–86.ArticlePubMedPMC
- 4. Cardona-Benavides IJ, de Ramón C, Gutiérrez NC. Genetic abnormalities in multiple myeloma: prognostic and therapeutic implications. Cells 2021;10:336.ArticlePubMedPMC
- 5. Usmani SZ, Hoering A, Cavo M, Miguel JS, Goldschimdt H, Hajek R, et al. Clinical predictors of long-term survival in newly diagnosed transplant eligible multiple myeloma: an IMWG Research Project. Blood Cancer J 2018;8:123.ArticlePubMedPMCPDF
- 6. Dimopoulos MA, Kastritis E, Michalis E, Tsatalas C, Michael M, Pouli A, et al. The International Scoring System (ISS) for multiple myeloma remains a robust prognostic tool independently of patients’ renal function. Ann Oncol 2012;23:722–9.ArticlePubMed
- 7. Palumbo A, Avet-Loiseau H, Oliva S, Lokhorst HM, Goldschmidt H, Rosinol L, et al. Revised international staging system for multiple myeloma: a report from International Myeloma Working Group. J Clin Oncol 2015;33:2863–9.ArticlePubMedPMC
- 8. Rajkumar SV, Dimopoulos MA, Palumbo A, Blade J, Merlini G, Mateos MV, et al. International Myeloma Working Group updated criteria for the diagnosis of multiple myeloma. Lancet Oncol 2014;15:e538–48.ArticlePubMed
- 9. Walker R, Barlogie B, Haessler J, Tricot G, Anaissie E, Shaughnessy JD Jr, et al. Magnetic resonance imaging in multiple myeloma: diagnostic and clinical implications. J Clin Oncol 2007;25:1121–8.ArticlePubMed
- 10. Bäuerle T, Hillengass J, Fechtner K, Zechmann CM, Grenacher L, Moehler TM, et al. Multiple myeloma and monoclonal gammopathy of undetermined significance: importance of whole-body versus spinal MR imaging. Radiology 2009;252:477–85.ArticlePubMed
- 11. Ailawadhi S, Abdelhalim AN, Derby L, Mashtare TL, Miller KC, Wilding GE, et al. Extent of disease burden determined with magnetic resonance imaging of the bone marrow is predictive of survival outcome in patients with multiple myeloma. Cancer 2010;116:84–92.ArticlePubMed
- 12. Moulopoulos LA, Dimopoulos MA, Christoulas D, Kastritis E, Anagnostou D, Koureas A, et al. Diffuse MRI marrow pattern correlates with increased angiogenesis, advanced disease features and poor prognosis in newly diagnosed myeloma treated with novel agents. Leukemia 2010;24:1206–12.ArticlePubMed
- 13. Moulopoulos LA, Gika D, Anagnostopoulos A, Delasalle K, Weber D, Alexanian R, et al. Prognostic significance of magnetic resonance imaging of bone marrow in previously untreated patients with multiple myeloma. Ann Oncol 2005;16:1824–8.ArticlePubMed
- 14. Song IC, Kim JN, Choi YS, Ryu H, Lee MW, Lee HJ, et al. Diagnostic and prognostic implications of spine magnetic resonance imaging at diagnosis in patients with multiple myeloma. Cancer Res Treat 2015;47:465–72.ArticlePubMed
- 15. Dutoit JC, Verstraete KL. MRI in multiple myeloma: a pictorial review of diagnostic and post-treatment findings. Insights Imaging 2016;7:553–69.Article
- 16. Narquin S, Ingrand P, Azais I, Delwail V, Vialle R, Boucebci S, et al. Comparison of whole-body diffusion MRI and conventional radiological assessment in the staging of myeloma. Diagn Interv Imaging 2013;94:629–36.ArticlePubMed
- 17. Terpos E, Morgan G, Dimopoulos MA, Drake MT, Lentzsch S, Raje N, et al. International Myeloma Working Group recommendations for the treatment of multiple myeloma-related bone disease. J Clin Oncol 2013;31:2347–57.ArticlePubMedPMC
- 18. Xiao W, Wang Y, Pacios S, Li S, Graves DT. Cellular and molecular aspects of bone remodeling. Front Oral Biol 2016;18:9–16.ArticlePubMed
- 19. Nakashima T, Hayashi M, Fukunaga T, Kurata K, Oh-Hora M, Feng JQ, et al. Evidence for osteocyte regulation of bone homeostasis through RANKL expression. Nat Med 2011;17:1231–4.ArticlePubMed
- 20. Delgado-Calle J, Anderson J, Cregor MD, Hiasa M, Chirgwin JM, Carlesso N, et al. Bidirectional notch signaling and osteocyte-derived factors in the bone marrow microenvironment promote tumor cell proliferation and bone destruction in multiple myeloma. Cancer Res 2016;76:1089–100.ArticlePubMedPMC
- 21. Hanrahan CJ, Christensen CR, Crim JR. Current concepts in the evaluation of multiple myeloma with MR imaging and FDG PET/CT. Radiographics 2010;30:127–42.ArticlePubMed
- 22. Kusumoto S, Jinnai I, Itoh K, Kawai N, Sakata T, Matsuda A, et al. Magnetic resonance imaging patterns in patients with multiple myeloma. Br J Haematol 1997;99:649–55.ArticlePubMed
- 23. Dimopoulos M, Terpos E, Comenzo RL, Tosi P, Beksac M, Sezer O, et al. International myeloma working group consensus statement and guidelines regarding the current role of imaging techniques in the diagnosis and monitoring of multiple myeloma. Leukemia 2009;23:1545–56.ArticlePubMed
- 24. Zamagni E, Nanni C, Patriarca F, Englaro E, Castellucci P, Geatti O, et al. A prospective comparison of 18F-fluorodeoxyglucose positron emission tomography-computed tomography, magnetic resonance imaging and whole-body planar radiographs in the assessment of bone disease in newly diagnosed multiple myeloma. Haematologica 2007;92:50–5.ArticlePubMed
- 25. Delorme S, Baur-Melnyk A. Imaging in multiple myeloma. Recent Results Cancer Res 2011;183:133–47.ArticlePubMed
- 26. Baur-Melnyk A, Buhmann S, Becker C, Schoenberg SO, Lang N, Bartl R, et al. Whole-body MRI versus whole-body MDCT for staging of multiple myeloma. AJR Am J Roentgenol 2008;190:1097–104.ArticlePubMed
- 27. Moulopoulos LA, Dimopoulos MA, Kastritis E, Christoulas D, Gkotzamanidou M, Roussou M, et al. Diffuse pattern of bone marrow involvement on magnetic resonance imaging is associated with high risk cytogenetics and poor outcome in newly diagnosed, symptomatic patients with multiple myeloma: a single center experience on 228 patients. Am J Hematol 2012;87:861–4.ArticlePubMed
- 28. Hillengass J, Zechmann CM, Nadler A, Hose D, Cremer FW, Jauch A, et al. Gain of 1q21 and distinct adverse cytogenetic abnormalities correlate with increased microcirculation in multiple myeloma. Int J Cancer 2008;122:2871–5.ArticlePubMed
- 29. Attal M, Harousseau JL, Stoppa AM, Sotto JJ, Fuzibet JG, Rossi JF, et al. A prospective, randomized trial of autologous bone marrow transplantation and chemotherapy in multiple myeloma. Intergroupe Français du Myélome. N Engl J Med 1996;335:91–7.ArticlePubMed
- 30. Child JA, Morgan GJ, Davies FE, Owen RG, Bell SE, Hawkins K, et al. High-dose chemotherapy with hematopoietic stem-cell rescue for multiple myeloma. N Engl J Med 2003;348:1875–83.ArticlePubMed
- 31. Koreth J, Cutler CS, Djulbegovic B, Behl R, Schlossman RL, Munshi NC, et al. High-dose therapy with single autologous transplantation versus chemotherapy for newly diagnosed multiple myeloma: a systematic review and meta-analysis of randomized controlled trials. Biol Blood Marrow Transplant 2007;13:183–96.ArticlePubMed
References
Figure & Data
References
Citations
- Lesions of the spinal cord caused by multiple myeloma: A systematic review and meta-analysis regarding the neurosurgical aspects of patient management
Daniel Encarnacion, Gennady E Chmutin, Ismail Bozkurt, Jack Wellington, Emmanuel Batista Geraldino, Bipin Chaurasia
Journal of Craniovertebral Junction and Spine.2023; 14(4): 313. CrossRef
 PubReader
 ePub Link
 Cite
Cite- Figure
-


- Related articles
-
- Effect of prehydration solution on hearing threshold after chemotherapy in patients with head and neck cancers: a retrospective study
- Clinical implication of adjuvant chemotherapy according to mismatch repair status in patients with intermediate-risk stage II colon cancer: a retrospective study
- The clinical outcomes of second-line chemotherapy in patients with advanced pancreatic cancer: a retrospective study
- Magnetic resonance imaging texture analysis for the evaluation of viable ovarian tissue in patients with ovarian endometriosis: a retrospective case-control study

